I have written about the mapping of the physical geography of coasts in OpenStreetMap before several times. However, when i see people discussing coastal mapping these days and editing the OpenStreetMap wiki i still frequently get the impression that – while discussion contributions are usually well intended – they unfortunately all too frequently seem to be – well – fairly uninformed. Discussions often lack relevant background equally in terms of present day mapping practice (a matter which i also discussed more in depth in broader terms), the history of mapping in OpenStreetMap and concerning actual geography.
Which is why i feel like it might be a good idea to provide a solid background on the very basics of coastal physical geography mapping in OpenStreetMap – which i am going to attempt doing here.
Current coastal mapping conventions in OpenStreetMap
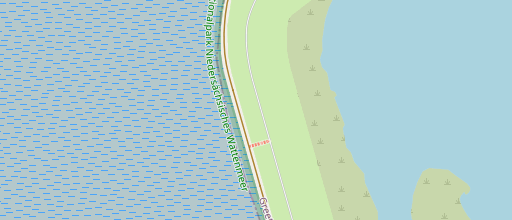
I will start with describing what the currently most widespread mapping practice is in OpenStreetMap for mapping and tagging basic coastal features. And i will use the rendering from the Alternative-Colors style here for illustration because it is more descriptive for coastal features. You can see the OSM-Carto variant when clicking on the images. Of course there is a large variety of different coastal settings with dozens of different tags, in particular if you include vegetated coasts. So i will only cover the very basics here. First, lets look at a setting with a relatively low tidal range, strong waves and a relatively steep slope of the coast:

Wave dominated sandy coastal setting
As most mappers will know, the coastline is placed at the high water mark (that is the highest level of water regularly reached during the tidal cycle). In the map examples shown this is the line between the bluish parts on the left and the yellow/gray areas on the right. The low water mark (lowest level of water regularly reached during the tidal cycle) is not necessarily explicitly mapped because it is practically not well verifiable – but for clarity i marked it here in the illustrations with an administrative boundary (which in many jurisdictions happens to be located at the low water mark).
What we have here is a wave dominated setting and a sandy beach. This is mapped in OpenStreetMap with natural=beach and surface=sand – which does not imply recreational use, it is purely a physical geography characterization. What is tagged natural=beach is the whole range covered by loose material that is shaped primarily by waves. In such a setting that range extends from slightly below the low water mark to slightly above the high water mark. Any area of loose sand above the high water mark that is not primarily shaped by water waves but by wind is by current conventions in OpenStreetMap not tagged natural=beach but natural=sand. Some mappers split the mapping of the beach at the coastline and tag the lower part in addition with tidal=yes. This does not provide any additional information, but it does not hurt either.
Practically, when mappers map remotely based on aerial/satellite imagery, the beach is often mapped downward only to the waterline of the moment as depicted in the image – and in case mapping is coarse or the image quality is insufficient for more precise placement, the coastline is also placed at this (typically too low) location. Still current mapper consensus about how things should be mapped ideally is clearly as described.
Sand areas below the low water mark that are permanently covered by water are typically tagged (as far as mappers have knowledge of that) with natural=reef + reef=sand.
The same scenario is of course also possible with the beach composed of coarser material – like surface=gravel or surface=shingle.
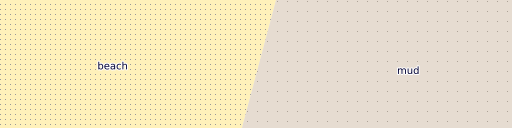
How do things look like in a more tidally dominated setting (more gentle slope of the coast overall, stronger tides and less strong waves)?

Tide dominated sandy coastal setting
In this scenario you typically still have a beach at the upper end of the tidal range – but it tends to be fairly narrow – or even can be fully absent in cases where waves are negligible or the coast is vegetated. Below that, in the tidal range, you can typically find a tidal flat, an area with very gentle slope consisting of fine grained loose material (mud or sand) that is shaped primarily by the tidal currents rather than waves. This area is by current convention tagged natural=wetland + wetland=tidalflat, sometimes with an additional surface tag (surface=sand or surface=mud).
In case of rocky coasts there is no distinction between above and below the high water mark in terms of primary tagging – natural=bare_rock is used in the tidal range just like on land.

Rocky coastal setting
History of coastal tagging
What i have described above is the currently most widespread practice of mapping coastal physical geography in OpenStreetMap. Most mappers evidently find this suitable for the most part, but there is quite a bit of variation and edits on the OSM wiki and comments made in various settings also indicate that some mappers find this practice undesirable or confusing. To understand this it is helpful to look at the history of tagging in OSM – because what i sketched above has not always been how coastal land forms are mapped in OpenStreetMap.
As most people know, OpenStreetMap started in the United Kingdom and in the UK the traditional cartographic conventions for representation of coastal forms distinguish not between different geo-morphological settings but exclusively between different surface materials. Tidal areas are classified as either sand or mud – as you can see here in the map keys of two different Ordnance Survey maps:

Legend from Ordnance Survey map 1:25k from 1966

Legend of contemporary Ordnance Survey map 1:50k
This concept was reproduced in the very early mapping practice in OpenStreetMap with natural=beach and natural=mud. Of the tags discussed these were the most widespread in use until about 2011. These two tags were, for use in the tidal range, in particular also promoted by the standard map style, which showed them both with a regular dot grid pattern.
natural=beach/natural=mud rendering in OSM-Carto version 1
Use of other tags, in particular natural=wetland + wetland=tidalflat and natural=sand became popular only somewhat later. Coastal mapping outside the UK almost exclusively used natural=wetland + wetland=tidalflat for both sandy and muddy tidal flats and natural=beach was not adopted significantly as a general tag for sandy areas in the tidal range outside the UK but was more strictly limited to beaches in the geo-morphological sense (as well as artificially created sand stretches at the shorelines of lakes and the sea). In the UK, use of natural=beach for larger flat areas in the tidal range was disputed quite early as well with some mappers preferring to adopt the continental European practice of using natural=wetland + wetland=tidalflat in general while others pushed for maintaining the mud-sand duality from Ordnance Survey maps on the level of primary tagging and to use natural=wetland only for muddy tidal flats while using natural=sand for sandy flat areas in the tidal range.
The use of natural=sand in the tidal range stayed a niche exotic use outside the UK so far despite some wiki-fiddlers trying to push this as the universal ought-to-be tagging. It gained some adoptions in regions with a mixture of sandy and rocky tidal areas, because – as described above – on rocky coasts mapping consensus is to use natural=bare_rock both in the tidal range and for dry rock above the high water mark and it can seem plausible to use natural=sand in analogy. Most mappers, however, seem to consider it better not to use the same primary tag for the geo-morphologically fairly contrasting settings of coastal dunes and sandy tidal flats and consider natural=wetland + wetland=tidalflat a suitable tagging for sandy tidal flats – with the option to specify that via surface=sand.
Practical examples
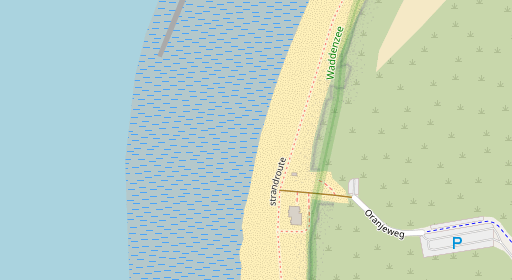
So far, i have discussed coastal mapping here on a fairly abstract level. So i will provide a few practical examples to illustrate what i explained above and to show in how far practical mapping in OSM consistently follows these conventions and where it sometimes diverges.
All examples are shown with a photo – linked to a larger version on an external site – and a map screenshot from OSM-Carto showing the current mapping in OpenStreetMap and linked to osm.org where you can inspect it in more detail. Be aware that the direction of view in the photos is not universally northwards so the photo and the map typically have different orientation.
First a classical wave dominated beach:

by Bin im Garten – CC-BY-SA 3.0
This example is a bit special because the sand is artificially groomed for recreational use, making it difficult to identify the upper end of the beach and the high water mark. The mapping correctly represents the existence of wind shaped stretch of loose sand above the beach. It does not extend the beach mapping below the high water mark, which is quite common though, as already mentioned above.

Next example is equally a wave dominated beach:

by dronepicr – CC-BY 2.0
Here mapping and tagging are based on imported data and therefore do not match manual mapping conventions in OpenStreetMap that well. The natural=beach mapping includes the non-vegetated parts of the coastal dunes. On the other side the beach ends at the high water line and the tidal part of the beach is mapped with natural=wetland + wetland=tidalflat – though the image shows quite clearly a wave formed beach, at least down to the water level shown in the photo.
The next two examples are more edge cases between a wave shaped beach and a tidal flat shaped by tidal currents.

 by UK Environment Agency – OGL 3.0

Both are mapped with natural=beach – above and below the high water line. A good argument can be made though that this is more fitting for natural=wetland + wetland=tidalflat + surface=sand as you can see substantial structuring of the surface due to tidal currents. In addition, the coastline in the second of these two samples is placed too low, significantly below the high water line, probably because it was mapped from images based on the water level of the moment as shown in those. In the first case the mapping of the beach reaches too far upwards into the vegetated areas.
Much more clearly a tidal flat setting can be found here:

by UK Environment Agency – OGL 3.0
which mapping accurately represents with natural=wetland + wetland=tidalflat + surface=sand.
An even clearer case is this example
.jpg)
by Bundesanstalt für Wasserbau – CC-BY 2.0
which directly matches the tidally dominated setting sketched above – though the mapping here conflates the lower end of the beach and the beginning of the tidal flat with the high water mark. The photo, however, clearly shows that the transit from the wave shaped beach to the tidally shaped flat is significantly below the high water line.

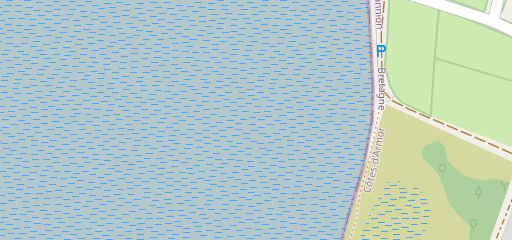
Another somewhat different example is here – where the (unmapped) beach is very narrow and cut short at the upper end by a constructed dyke:

by Bermicourt – CC-BY-SA 3.0
So far these were ground level or oblique aerial photos. I want to close with an orthophoto example, providing some hints how the delineation between a wave shaped beach and a tide shaped tidal flat can be practically made when mapping from imagery.
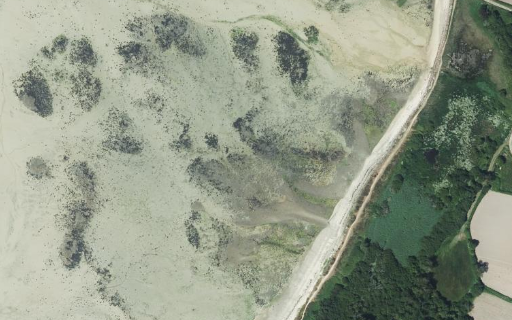
by IGN France
The beach here is currently not mapped but can be well seen on the image. Typically, waves create structures parallel to the coast while tidal currents produce structures orthogonal to the coast roughly in direction of the coastal slope. Also beaches with their stronger slope often drain water faster at low tide and do not remain waterlogged as much as tidal flats at low tide – which will often lead to different coloring on images. The most reliable source of information is, of course, always observation on the ground.
Conclusions
The obvious question some will probably ask is why does the OSM community not adopt the Ordnance Survey convention to distinguish by surface material only and not by some fairly specialized geo-morphological classification? There are several reasons that probably play a role here:
- Most mappers consider the distinction between different geo-morphological forms (beaches, tidal flats, coastal dunes etc.) as more meaningful than the distinction between different surface materials.
- In remote mapping from aerial/satellite imagery, the distinction between beaches and tidal flats as geo-morphological forms can often be made with careful observation of the images while the distinction by surface material cannot.
- In most regions on Earth, sand and a mixture of sand and finer material are more common as surface material of tidal flats than mud, making the geo-morphological classification simply the only meaningful distinction that can be made.
The more relevant point i am trying to make here is, however, that this example illustrates well how developing globally uniform tagging conventions in OpenStreetMap is hard, in particular because of pre-existing diverging cartographic conventions in different parts of the world. Although OpenStreetMap has a free form tagging system and deliberately is not based on institutional data models and classifications, those still tend to color tagging ideas in the project. I hope this example shows how not sticking to a specific cartographic tradition but opening up to more diverse mapping and tagging ideas from all over the world, developed by people based on how they perceive the local geography, helps to develop a more differentiated way to see and document the diverse global geography.
And i also hope that the desire for simplicity and the prioritization of data volume over data depth, that is understandably felt and expressed by many mappers these days, does not lead to a rolling back of these substantial achievements in the name of ‘modernization’ – as we have unfortunately seen all too often already in OpenStreetMap.


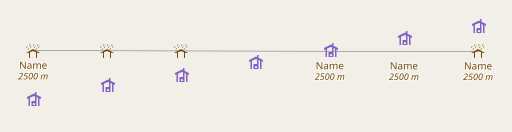
 AC-Style with separately rendered symbols and labels
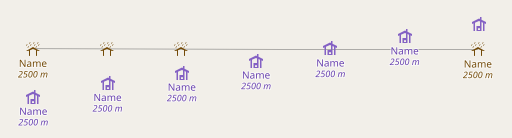
 AC-Style with combined symbol and label placement
 separately rendered symbols and labels connected via anchors