
On February 11 last year Landsat 8 was launched and in March/April started taking images. Time to look back at the first year of operations (which is not yet fully completed of course). The USGS is providing a list of all scenes acquired until today. The sheer volume is quite impressive. There are a total of about 168000 scenes. That is an average of more than 500 scenes per day despite a few smaller interruptions of acquisition. Calculating with an average of 900MB per scene (sizes vary a bit between about 800MB and over 1000MB) the total data volume is about 150TB or more than 25kg of 4TB harddisks. I am calculating with the processed Level 1 scenes here – the USGS surely also archives the raw data from the satellite which is probably quite a bit smaller though.
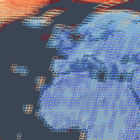
I visualized how these scenes are distributed in the following images – the color always indicates the number of scenes acquired. First an image of all regular scenes, i.e. scenes from the descending part of the orbit on the day side of earth.
")
You can see the major land masses are quite evenly covered. The polar regions are somewhat different – the lower scene counts are misleading though since there is larger overlap between the WRS2 tiles here and therefore you achieve much better temporal coverage with less scenes. These statistics of course also do not take into account the varying quality of the images, especially due to cloud cover.
There are a few lines of scenes over the Pacific Ocean acquired early last year probably for some calibration purpose.
Incomplete coverage exists over Antarctica (which might still be supplemented in the coming months) and in the Canadian Arctic. The latter is somewhat peculiar – this area is however quite well covered by the ascending orbit scenes as can be seen in the next image. One possible reason for this i could imagine are scheduling constraints – Landsat 8 can acquire about 500 scenes per day but i am not sure if this means any 500 scenes from that day can be acquired. If not acquisition of certain scenes on the same day together might not be possible.
")
The ascending scenes are generally on the night side of earth but in polar regions during summer there is sunlight for those as well so they offer additional imaging opportunities. On the lower latitudes the scenes are in full darkness so they are mostly from volcanic areas and for recording thermal infrared emissions. In the western US there are a few areas regularly covered apparently.
I also made separate illustrations for the seasonal coverage with April-May, June-August September-November and December-February:
")
")
")
")
You can nicely see here how the scene acquisition follows the seasons with only very few scenes acquired in the polar regions during winter (those, like in central Greenland on the last image are probably mostly for surface temperature assessment).
Finally i also prepared a video of all the acqusitions. A small size version of it can be viewed right below
[videojs width=”512″ height=”256″ poster=”http://www.imagico.de/files/landsat8_scenes_small.png” ogg=”http://www.imagico.de/files/landsat8_scenes_small.ogv” mp4=”http://www.imagico.de/files/landsat8_scenes_small.mp4″]
It looks much better in larger though – which is not really suited for in browser viewing, you can download it here: