More than a month without new posts here on the blog – i have been busy with a number of things including what i introduce here.
A bit of history first: I have been working with Landsat images and the problem of assembling them to seamless mosaics since first Landsat data got available as public domain after 2000 and extended this after all Landsat data got freely available in 2008. Most of this work was and is targeted at the production of 3d views but i also produce and offer mosaics for 2d use (like here and here).
I have not been the only one of course. Landsat images form the basis of most map services that offer a satellite image layer at low and medium resolutions. In princple assembling such a global Landsat layer is not a big deal. The way this has been done for most such assemblies is by hand picking a well suited scene for each WRS2 tile – criteria being (1) cloud freeness and (2) uniform season within an area and assembling them more or less blindly by overlaying and blending the overlaps into a common mosaic. If you add a bit of relative color calibration (i.e. adjust the colors of each scene to minimize the difference to neighboring scenes) the results do not look too bad. The problems with this approach are:
- The results are only cloud reduced, not cloud free since in many parts of the world you will not find a single scene that is fully free of clouds.
- How well it works depends on how large the collection of scenes is you pick from. The usual mosaics you see in map services today use the Landsat 7 scenes from between 1999 and 2003, a little more than 3 years in total.
- It does not work for Landsat 7 images from after Autumn 2003 due to the SLC failure which rendered the images mostly unsuited for this approach due to gaps.
These problems combined are the reason why map services still largely use 12-15 year old Landsat images – later Landsat 7 data is hampered by the SLC defect and there is not yet enough Landsat 8 data for a global coverage with uniformity and cloud freeness comparable to the legacy Landsat 7 mosaics.
The only large scale assembly i know of that addresses the third problem and uses newer SLC-off Landsat 7 data is the Google mosaic.
Long story short – the only way you can produce a good quality up-to-date Landsat mosaic today is combining data from different satellites. Apart from the data quality limitations of each of them there are a large number of other quality criterias to consider – cloud cover, haze and dust, season, age of the scene, lighting just to name a few. Unlike for the Green Marble mosaic where the colors are calculated based on large scale statistics of several hundred color values for each pixel here i have at best a handful of suitable source image, at worst only 1 or 2.
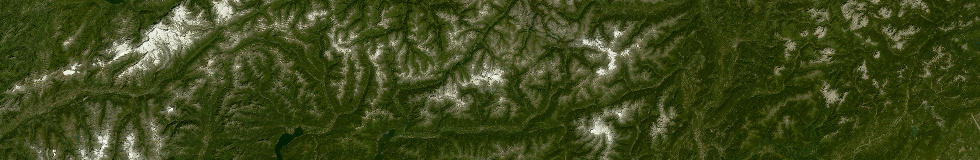
On a smaller scale for individual 3d views i have been developing and testing approaches to this problem for some time. I here introduce the first larger scale application of these techniques with a Landsat mosaic covering Germany, Switzerland and Austria als well as some areas around. The results can be seen below.

The primary criterion for assembly here was the mosaic should be based on the newest data while still maintaining a roughly constant summer season time frame. Since there have been only two summers with Landsat 8 data to date these images do not provide full cloud free coverage so i supplemented them with Landsat 7 data of similar age. Only were neither of these provide acceptable quality data older Landsat 7 and 5 data is used as a backup source. Since both the Alps and the agricultural areas of northern Germany feature strong short term variation in the actual surface color there are quite significant differences visible where data sources change. The only individual scene adjustment i made is compensation for atmospheric influences, otherwise the colors are meant to resemble the ground level appearance and the seasonal differences in the source data mostly show up in the final product, in other words color accuracy has higher priority that overall uniformity.
The resulting image is more up-to-date, has more accurate colors and is in general more representative of the real surface appearance that all other Landsat mosaics i know of. Here two magnified samples with Bing and Google mosaics for comparison:
The first is from a Lignite mine near Cottbus

Since the area changes due to the progress of mining you can well see here the difference in age of the various image mosaics – Bing on the left and Google on the right, Mapbox (which is based on the same images as Bing) is also shown when you click on the link:

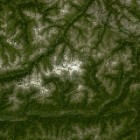
The second example is from the Alps in Austria (the High Tauern):

Again with Bing and Google for comparison:

Granted of course this is not a global image – while the techniques used are scalable this is much more expensive to generate in terms of computing ressources than a typical old fashioned Landsat mosaic, not even counting the hand work of scene selection.
Some numbers – the whole mosaic is 130000×166000 pixel in size. It uses 201 Landsat scenes, 131 Landsat 8 scenes, 53 new Landsat 7 slc-off scenes, 17 older Landsat 7/5 scenes. This is kind of like the famous 90-90 rule – 90 percent of the pixels are based on the first 90 percent of the Landsat scenes. The remaining ten percent are based on the other 90 percent of the scenes.
If you are interested in using this – the image is available on services.imagico.de. There you can also find a few more sample images from other areas.
April 17, 2015 at 04:32
Beautiful stuff Chris.
What is your process for acquiring the data and assembling these mosaics? At some level I’m assuming you have to hand-curate each scene, but is there any level of automation built in?
Best!
– J
April 17, 2015 at 10:40
Thanks Jacques,
the main hand work steps involved are (a) initial scene selection and partly (b) cloud masking. (a) is mostly done to avoid the need for processing a lot of scenes which are ultimately not useful and (b) is done to get the best out of the relatively scarce data in critical areas. You can do without either of these but this would be more wasteful with regards to processing ressources and available data.