Over the last days i added a number of images to the OSM images for mapping produced from Sentinel-2 and Landsat data.
There are three new images for the Antarctic:
McMurdo Bay area
This image covers the McMurdo Sound, McMurdo Dry Valleys and Ross island. Data is from February 2017 – end of summer, but with quite a bit of seasonal sea ice cover still present.
There is a lot that can be mapped from this image in terms of topography, glaciers and other things. It can also be used to properly locate features where you only have an approximate position from other data sources. If you compare the image with existing data in OSM you will also see that there is significant mismatch in many cases. Positional accuracy of the image – like the other Antarctic images – is good but not great. In mountainous areas at the edge of the image swath (here: in the northwest) errors can be more than 50m probably on occasion but otherwise will usually be less.
Bunger Hills
Another part of the East Antarctic coast. This requires a bit of experience to distinguish between permanent and non-permanent ice. But existing mapping in the area is poor so there is a lot of room for improvement.
Larsen C ice shelf edge
This is an image for updating the ice shelf edge after the iceberg calving in 2017. The current mapping in OSM here is very crude since based on low resolution images.
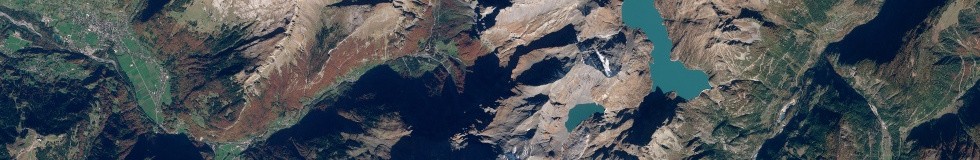
Western Alps autumn colors
And then there is another image which is more of an experiment. This is an autumn image from the western Alps that shows autumn colors and could be helpful for leaf_cycle mapping. I am not quite sure how well this works. You probably need some level of local knowledge to be able to interpret the colors correctly. The red-brown colored forested areas are usually deciduous broadleaved forest, in many cases beeches. Larches are more yellow in color and are often mixed with other types of trees which makes them more difficult to identify. Also the different types of trees change their colors at different times – also depending on the altitude – so a single image does not really cover everything and a solid local knowledge is probably important not to misinterpret the colors.
I would be interested in feedback about to what extent this image is useful for mapping leaf_cycle.
February 2, 2018 at 14:42
With respect to leaf_cycle and particularly identifying larch useful place to look on this imagery are:
As plant communities these fall in the Vaccinio-Piceenion (in Ellenberg’s scheme) and might be described in english as Larch-Swiss Stone Pine woodland. Most of my examples lack Swiss Stone Pine (Arve, Pinus cembra) in any quantity , but specific examples of woods containing good quantities of both trees are the Stazerwald between St Moritz and Pontresina and God Tamangur near Alp Astras S of S-charl (one of the highest woods in the Alps).
It’s useful to compare the green of these larch woods with, say, those around Courcheval, which are spruce.
You don’t mention it but some of the winter imagery of S Chile may also be suitable for identifying leaf_type: presuming the green areas represent Nothofagus antarctica/betuloides (Nire/Guindo).
Winter is always a good time to spot larch woodland both in the mountains & elsewhere. Perhaps we ought to make it a project: it’s one of the most amenable woodlands for more detailed tagging.
February 2, 2018 at 17:56
Hello Jerry,
thanks for the additional hints. It seems larch is often difficult to reliably identify in the Alps in this image for the reasons already mentioned and because it is not the ideal point of time everywhere (i.e. in some areas the color has not fully changed to yellow while in others the needles might already have been dropped). And in most areas where wooded areas at the tree line appear brownish that is probably larch – like here:
https://imagico.de/maps/#map=13/45.043/6.804&lang=en&l=sat&r=osmim&o=3&ui=0
https://imagico.de/maps/#map=13/45.824/7.564&lang=en&l=sat&r=osmim&o=3&ui=0
Yes, there are plenty of other areas where autumn images could help more specific woodland mapping. Northern Russia and Alaska also come to mind. Finding cloud free images is not easy though and since each will cover a different point of time in the color change interpretation would be very specific. Winter images could also help when there is not too much fresh snow in areas where summer images are available as well so you can reliably map the tree cover from those and determine the leaf_cycle from the lower resolution winter image.
Pingback: [Перевод] Новости из мира OpenStreetMap №393 (23.01.2018-29.01.2018) – CHEPA website
Pingback: [Перевод] Новости из мира OpenStreetMap №393 (23.01.2018-29.01.2018) | Компьюлента