I previously wrote about mapping Antarctica and following that and the podcast interview I organized an import of new coastline data for the continent into Openstreetmap together with Jochen. I already mentioned back then that this is only the first step on the way to a good coverage of the southern continent of our planet in Openstreetmap.
When looking into available data sources in February I also inquired for possible use of the Antarctic Digital Database and the Scientific Committee on Antarctic Research has granted permission to use this database as a source for Openstreetmap. I will here give a bit of background information on this data and the process of getting this into OSM.
First some background information – the Scientific Committee on Antarctic Research is coordinating scientific research activities in Antarctica and as such maintains a geographic database assembled from contributions of various nations conducting research on the continent. As a result of this the data is fairly heterogeneous which makes it actually quite similar to OSM data elsewhere. The primary focus of the ADD is on the coastlines.

I explained the special nature of the Antarctic coastline with the ice shelves in the previous post. The interesting thing is that while the ice shelf coastline is generally less stable than a normal coastline the rate of change is quite variable. The MOA coastline data imported in March which is now the basis of the Openstreetmap Antarctic coastline is based on satellite images from 2003/2004 and comparing it to the ADD data shows that large parts of the calving line of the ice shelves has not changed much while in other parts there are enormous differences as in the following image of the Wilkins Ice Shelf. The MOA coastline is drawn in red over the ADD data. The ADD also contains historical coastline data which shows this even better (click on image to see).

Quite in contrast to this the following image of the western Ross Ice Shelf shows a much slower change. Note the how the shape of the calving line is similar in both data sets with a slight advance in the newer data. This is actually the typical way the ice shelf edge changes – the ice is mostly continuously and slowly advancing, interrupted by larger calving events producing large icebergs (of which there has been none during this period in this area).

The ADD data documents these changes in the ice coastline very well with most data for the ice shelves and ice tongues from between 2009 and 2012. In addition the data for the rocky coastline is more detailed adding many small islands not in the MOA data.

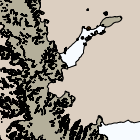
Apart from the coastline the ADD contains additional data of land features, in particular of ice free areas. There are layers with rock outcrops and moraines – the latter covering both on-glacier moraines as well as glacial deposits in ice free areas. This data is somewhat more difficult to use for several reasons: first there is a significant offset in some areas relative to the coastline data as in the following area in Eastern Antarctica:

Also note the data here is inconsistent by indicating both ice shelf (white) and rock (orange) which is mutually exclusive. In case of the coastline data the different sources have obviously been aligned – something that has not been done for the rock outcrop data apparently. In addition the classification as rock outcrop is somewhat liberal – the McMurdo Dry Valleys for example are fully mapped as such (see the following image).

While glacial deposits in those valleys are thin and non-continuous classification as rock outcrop does not seem correct (see this image on Wikipedia as an example).
The mentioned issues pose some problems when preparing this data for import into OSM. For the files now accessible from the OSM wiki for review I clipped the different areas to avoid overlaps (since Openstreetmap does not normally specify layers for the different features and polygons are assembled from lines usually shared between adjacent areas overlaps are generally a bad idea in OSM). Priority is given to the coastline layer features (coast and ice shelves) which are usually better quality – in case of the above example this is wrong though since those areas are in fact rocky.
When importing the MOA-Data the whole data set could be imported at once. Due to the much larger size of the ADD data this is no more possible here. The splitting planned is shown in the following image. On the Antarctic Peninsula where data is more detailed than elsewhere the sectors are divided further as shown.

How the ADD data attributes are translated into OSM tags I have documented on a wiki page. Questions and suggestions are welcome here, in the Wiki or on the OSM mailing lists. And of course help with the actual import will be much appreciated.