To get this out upfront: this post is not about data quality – what i am going to talk about here is the mechanisms how OpenStreetMap functions and how these principles can break down.
In a nutshell – how OpenStreetMap works is that everyone can contribute to the database and thereby create something valuable others can use, in maps and other applications using OSM data. The real key however is that when you do so others contributing in the same area will then build upon your work, supplementing it with additional detail, updating information, correcting inaccuracies etc. This is what makes OSM attractive to contributors – you know your contribution matters, often even many years after you make it because you can be sure subsequent contributions will be supported by the basis you created. And it is attractive for data users because through this mechanism the result is usually significantly more valuable than the sum of all the individual contributions.
Those who know me might already imagine that when i talk about these principles breaking down i am talking about Canada, in particular about the Canadian North, the area you might best recognize from the distorted appearance in the Mercator projection:

The Canadian Arctic in OpenStreetMap
This region is one of the most sparsely populated areas of the northern hemisphere – Nunavut and the Northwest Territories have a combined population of less than 100000 the vast majority of which live south of the area discussed here which has likely less than 10000 inhabitants.
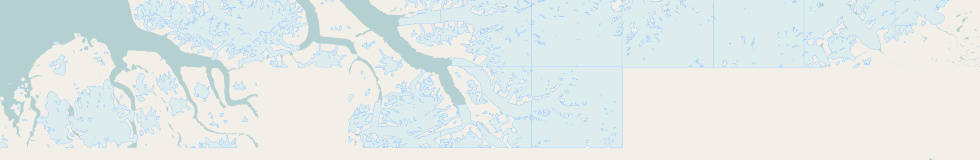
This makes it a fairly difficult area for mapping in OpenStreetMap. This is how this area looks like in terms of OSM node density – in a different, less distorting map projection:

I separated the data into three categories:
- legacy imports of coastline and larger waterbodies, mostly PGS, made about 8 years ago and not touched since then are shown in blue – overall 1.3 million nodes.
- unmodified Canvec data imports are shown in red – about 5.2 million nodes.
- everything else, meaning hand mapping as well as any imported nodes that have been modified afterwards are shown in green – about 500 thousand nodes.
Now if you ignore the red you could get the impression this looks reasonably healthy considering the remoteness of the area. If you look at the age of the data:

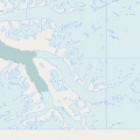
you can see most manual mapping activity is fairly recent and limited to smaller areas. The Canvec import stuff is shown in gray since node age and data age are not the same for imported data of course – Canvec imports were made during the last five years mostly. Now you cannot compare this to a densely populated area in Europe of course, there is very little local mapping on the ground and nearly all of the data – both imported and manually mapped – is produced remotely. But lets compare it to Greenland – an area with quite comparable population density, accessibility and geography:

When magnified both maps have the same scale by the way. Compared to northern Canada Greenland has much earlier and more extensive manual mapping activities. There are likewise legacy imports of coastline data, in particular at the west coast. Overall the data volume is comparable if you disregard the Canvec imports, Greenland is about 2 million nodes in total, legacy imports and manual mapping together is about 1.8 million nodes in the shown part of Canada.
So what causes the difference? The fairly obvious explanation are the Canvec imports. Except for the legacy coastline imports from many years ago there have been no imports of data in Greenland. If you look at the maps above and the data you can see while the manual editing activity supplements and replaces the legacy imports quite freely there is hardly any interaction between manual mapping and Canvec imports. About 200k of the 500k manual nodes have been edited after initial creation (are version >=2), most of these are manually refined legacy import coastlines. Significantly less than one percent of the Canvec import nodes have been edited afterwards and most of the manual editing activity you can see in Canvec import areas is simple mechanical cleanup. If you have ever tried doing manual mapping in an area where Canvec data has been imported you know why this is rare – i did so once in the far north and this is not something you really want to do. Canvec imports are essentially a foreign body in OSM regarding normal editing activites which then try to operate around these.
Remember above i wrote than OpenStreetMap works by contributions supporting and forming a basis for further subsequent contributions. Canvec data imports do not work this way, especially not in the high Arctic. In addition they neither work the other way round, i.e. by integrating and making use of previous manual contributions. If at all such imports bury previously mapped stuff under tons of data of questionable quality. And the outlook of this happening is not exactly an incentive for mappers to contribute, especially not if they can also do so a few hundred kilometers further east where no such problems exist.
Now i wrote initially this is not about data quality but still i want to deal with one of the key arguments of Canvec import proponents: that the Canvec data is of good quality and much better than what can in most cases be manually mapped from available imagery sources. This is wrong. Canvec data in this area is in most parts somewhat more detailed than available image sources but it is worse in about every other aspect:
- it is less up to date which is of particular importance in the Arctic due to glacier retreat and climate change. Most of the source data Canvec is based on in this area is at least ten years old, significant parts are much older (like 1980s).
- it is often factually incorrect, partly due to incorrect original mapping, partly due to incorrect attribute conversion.
Everyone who does not believe that i would highly recommend to look at the recent images from the OSM images for mapping in the area and compare them to the Canvec data.


Due to these problems the imported data does not even give valuable hints to mappers unfamiliar with the area how to map things – on the contrary it suggests incorrect tagging in many cases.
Another argument frequently brought up is that having additional data in the OSM database is an advantage on its own. In reality this hardly is the case – if data users find the Canvec data useful it is generally much easier to take it directly from the source where it is available in uniform quality and with all original attributes for the whole country. And if you consume data on this scale the slight possible advantage of having it in the OSM format you are used to already is usually not significant.
Long story short – the only way the Canadian OSM community could in the long term make sure the Canadian North is a valuable part of the OSM database and an area where it feels to be rewarding to contribute for mappers would be to put a stop to Canvec imports in the area and make an effort in removing the previously imported data. Otherwise the Canadian Arctic will likely continue to fall back behind the rest of the world in terms of community building as well as data usefulness – not despite the imports but because of the imports.
Some probably read into this i am generally against data imports in OSM but i am not – the key question for such however has to be if they support further mapping in OSM in the area of the import or not and in this case the answer is quite certainly no.
Now one thing i asked myself in the matter is if this is actually a deeper cultural difference between Europe and America, the old world and the new world. Being from Europe i am probably not unbiased on this – despite extensive experience in mapping in the Arctic. It is possible that what i wrote about mapper motivation and incentives applies to the typical European mapper but not the North American one. Since much of the manual mapping in Northern Canada is done by people from abroad even what can be observed from a neutral standpoint could be distorted in that direction. OpenStreetMap is built upon the principle of primacy of the local mappers – they decide on their own how things are mapped in their area and if data is imported. But is someone sitting in Toronto, Montreal or Vancouver really more of a local mapper on Devon Island or Ellesmere Island than someone from Britain, Germany or Russia?