Like last year i want to here provide a look at the image acquisition numbers and spatial distribution of recordings of the two main optical higher resolution satellite systems producing open data these days: Landsat and Sentinel-2.
Here is the updated plot of the total daily recorded image volume in square kilometers.
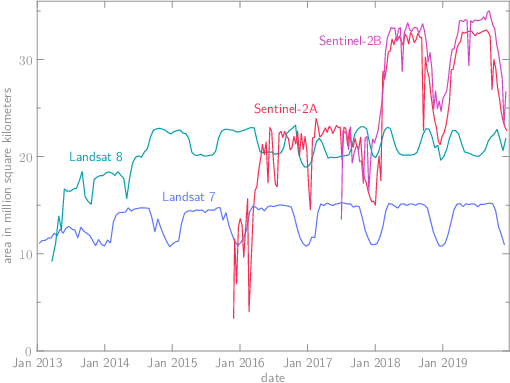
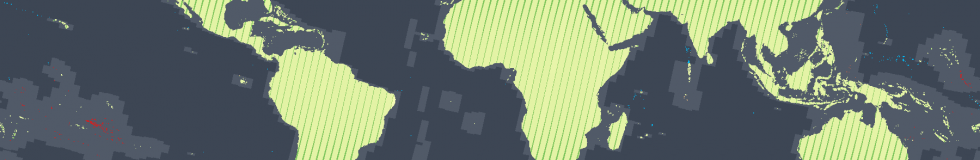
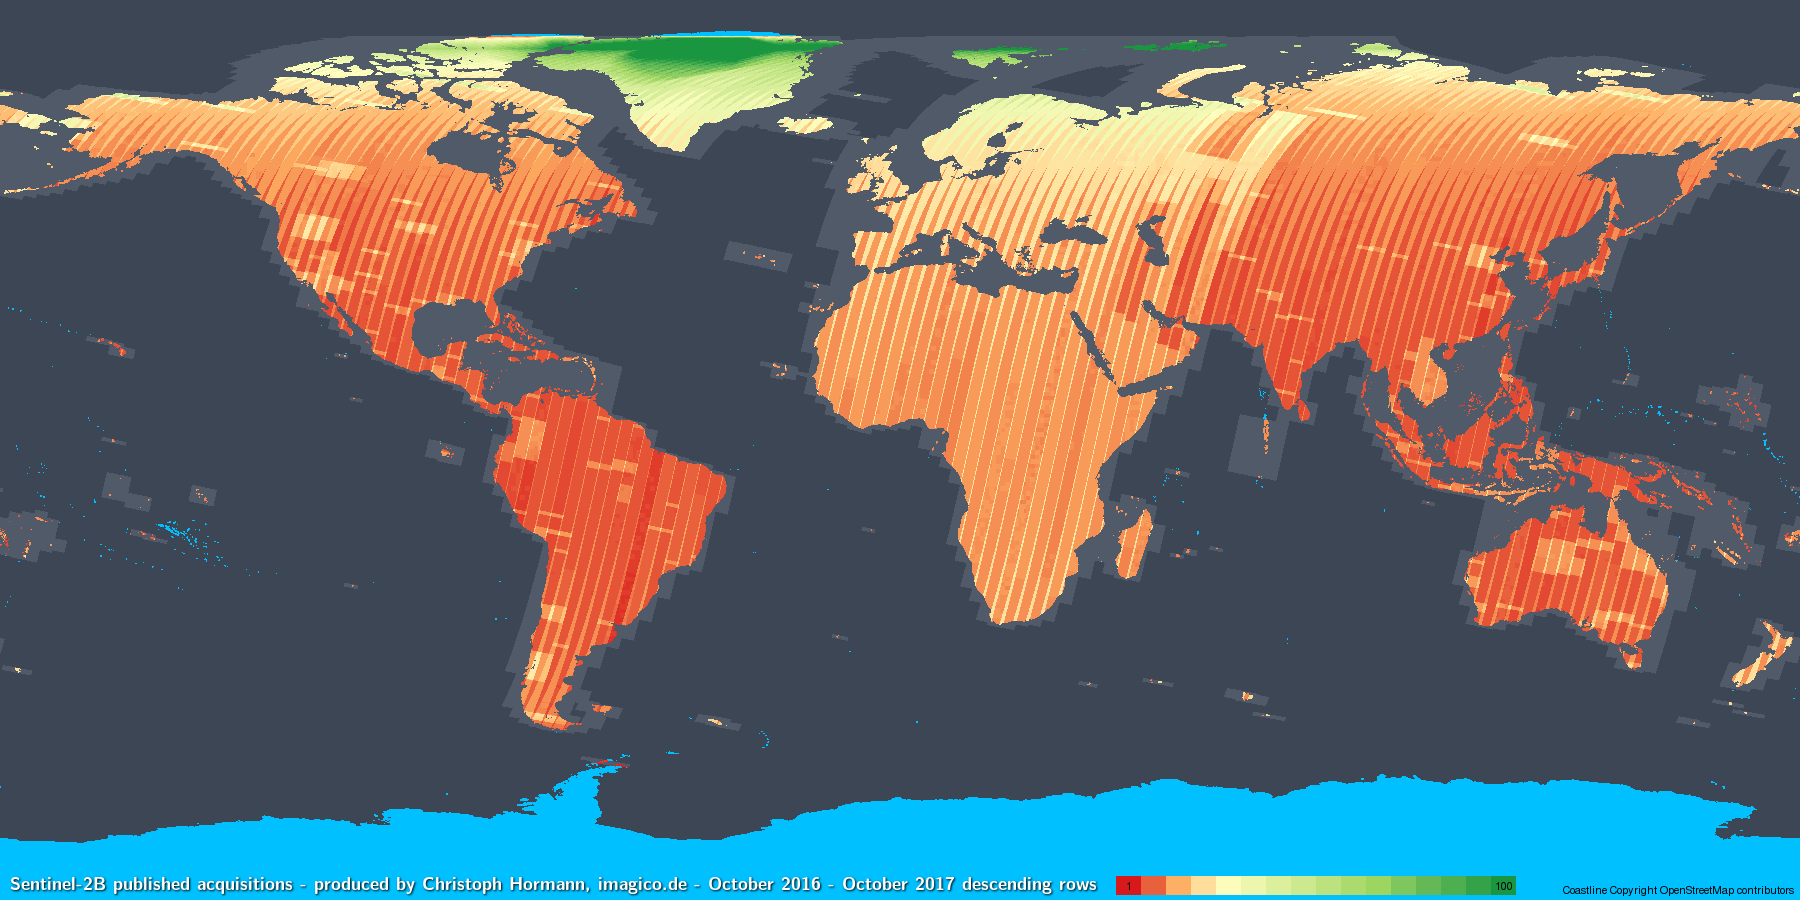
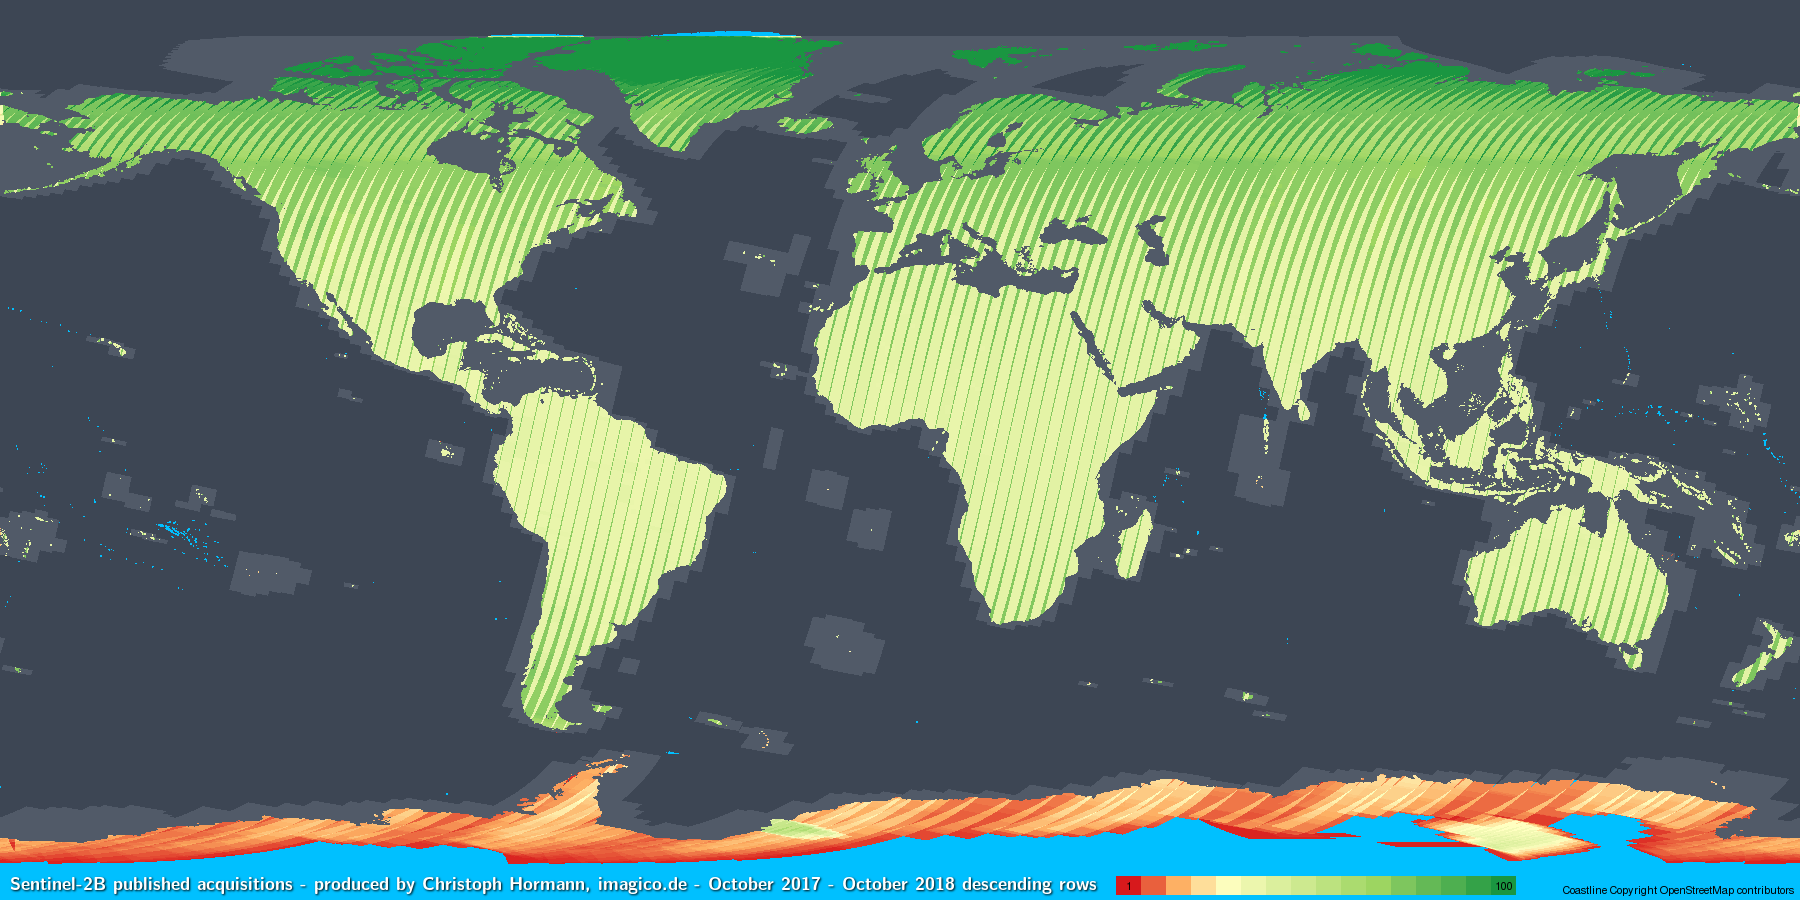
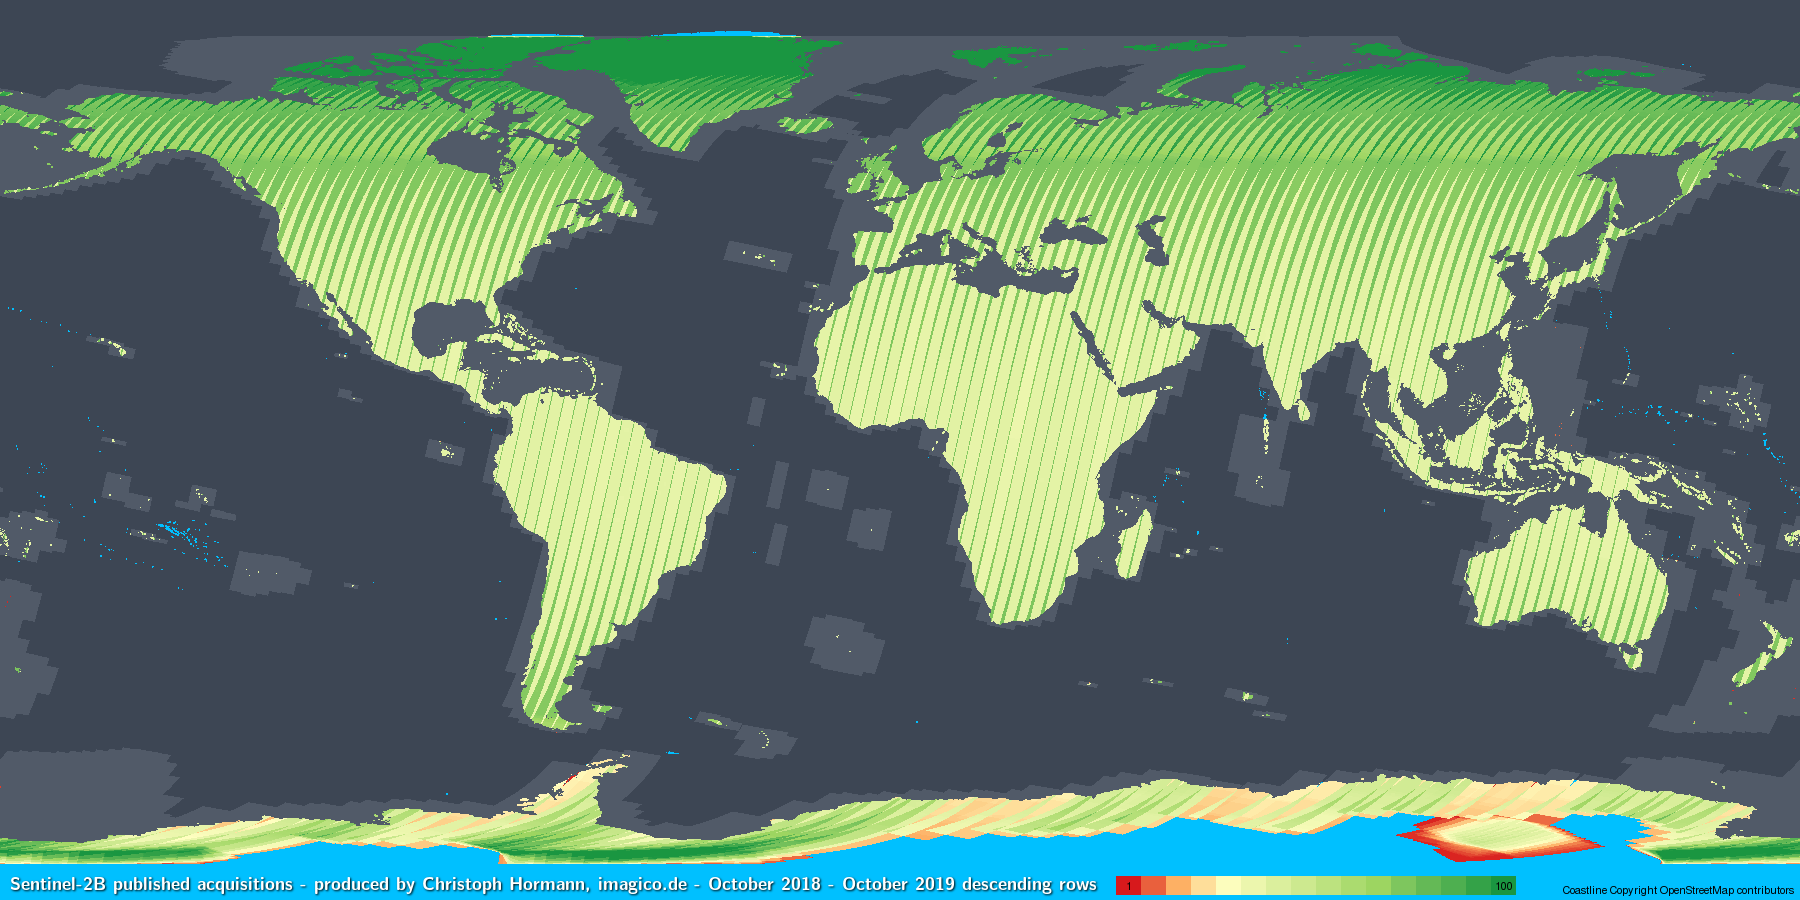
This indicates essentially the same recording pattern as last year and establishes a certain routine for the Sentinel-2 satellites over the course of two years for the first time. There is a slight increase in the recording volume of Sentinel-2B due to the extension of smaller islands coverage in the recording plans and the relaxation of the sun elevation limits in northern Europe. The latter you can also well see in the detailed recording patterns per orbital period:
Autumn coverage by Sentinel-2B
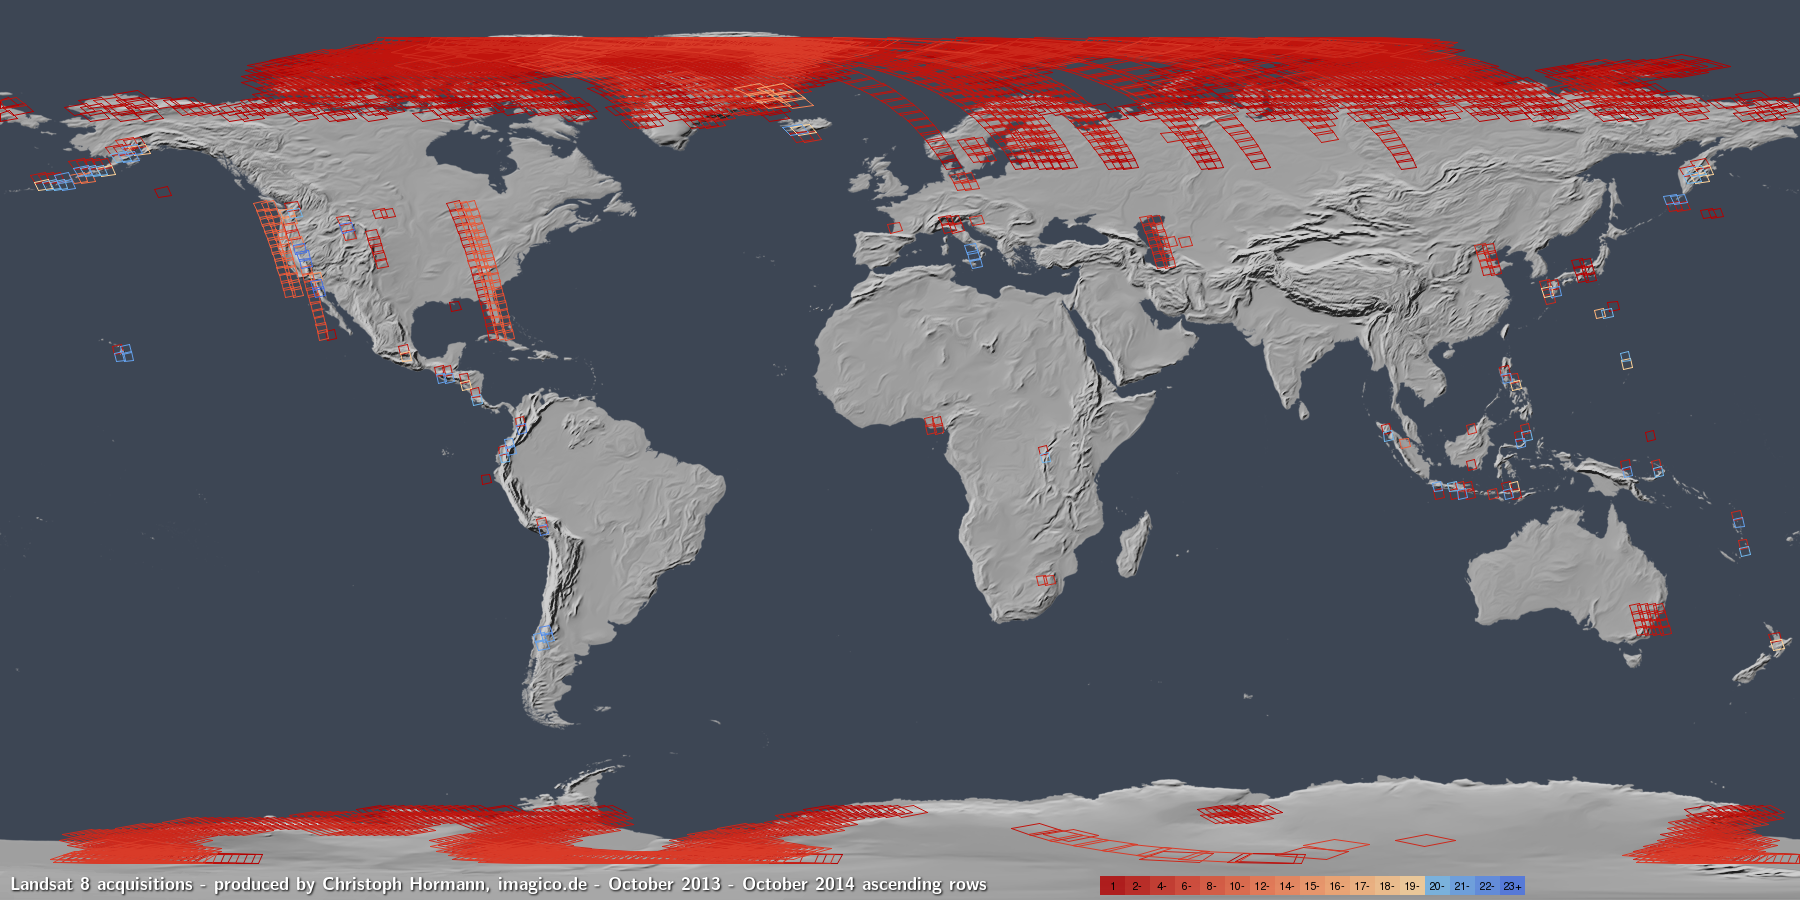
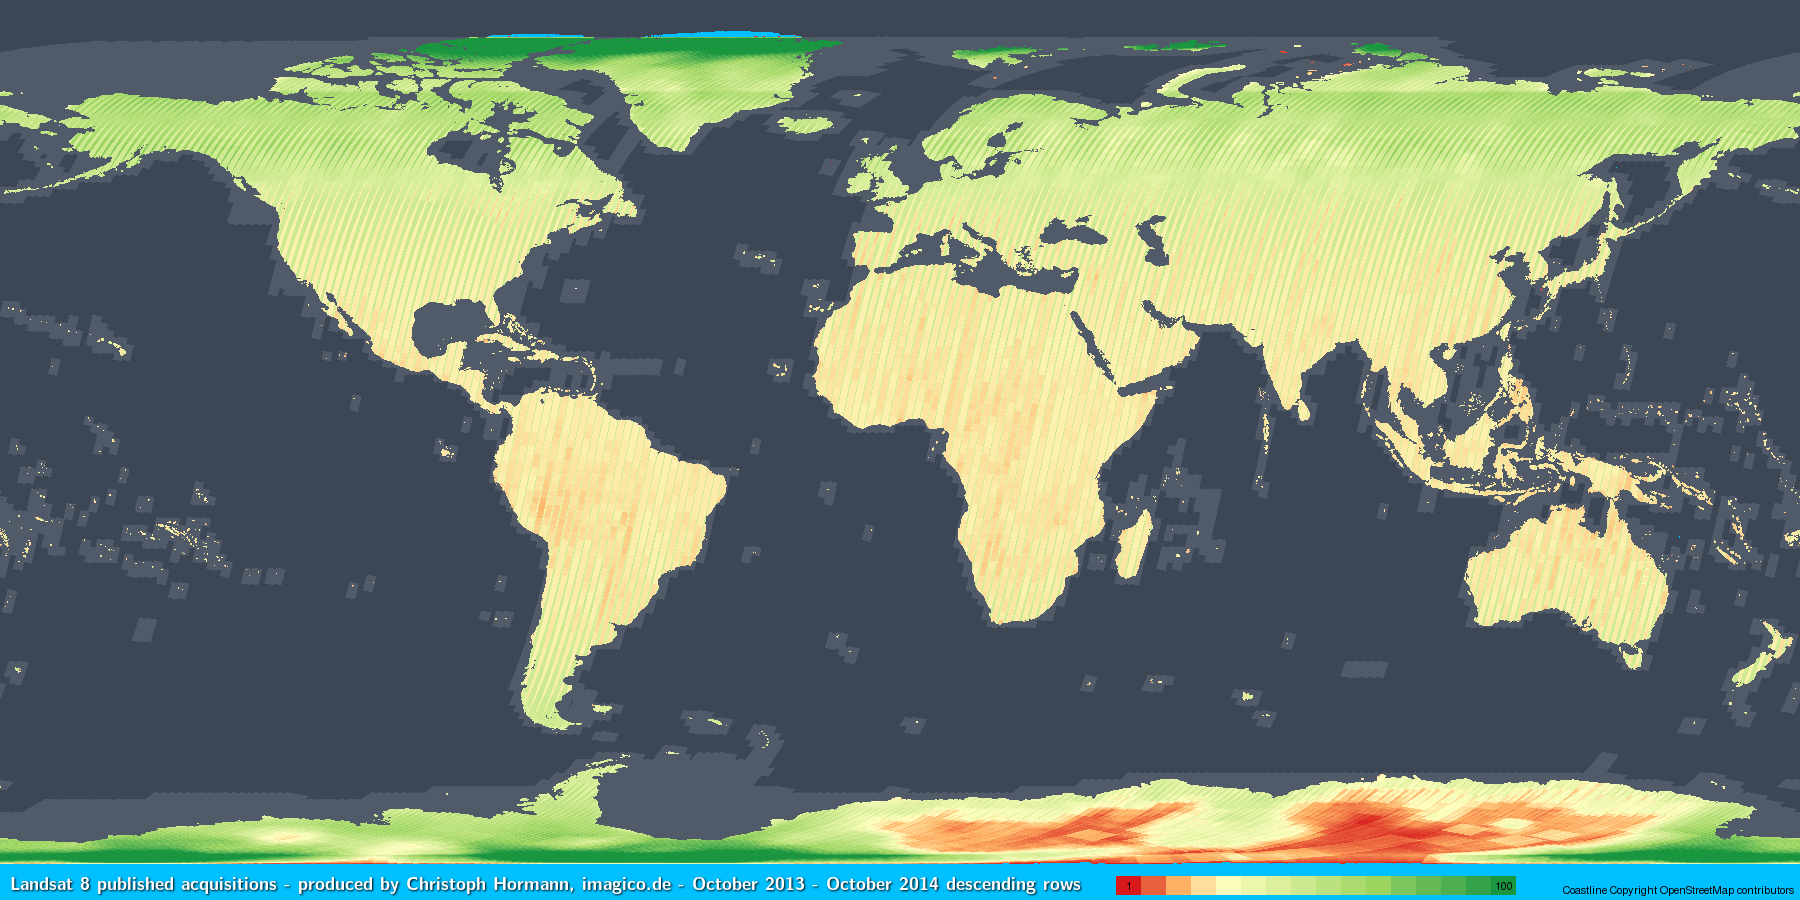
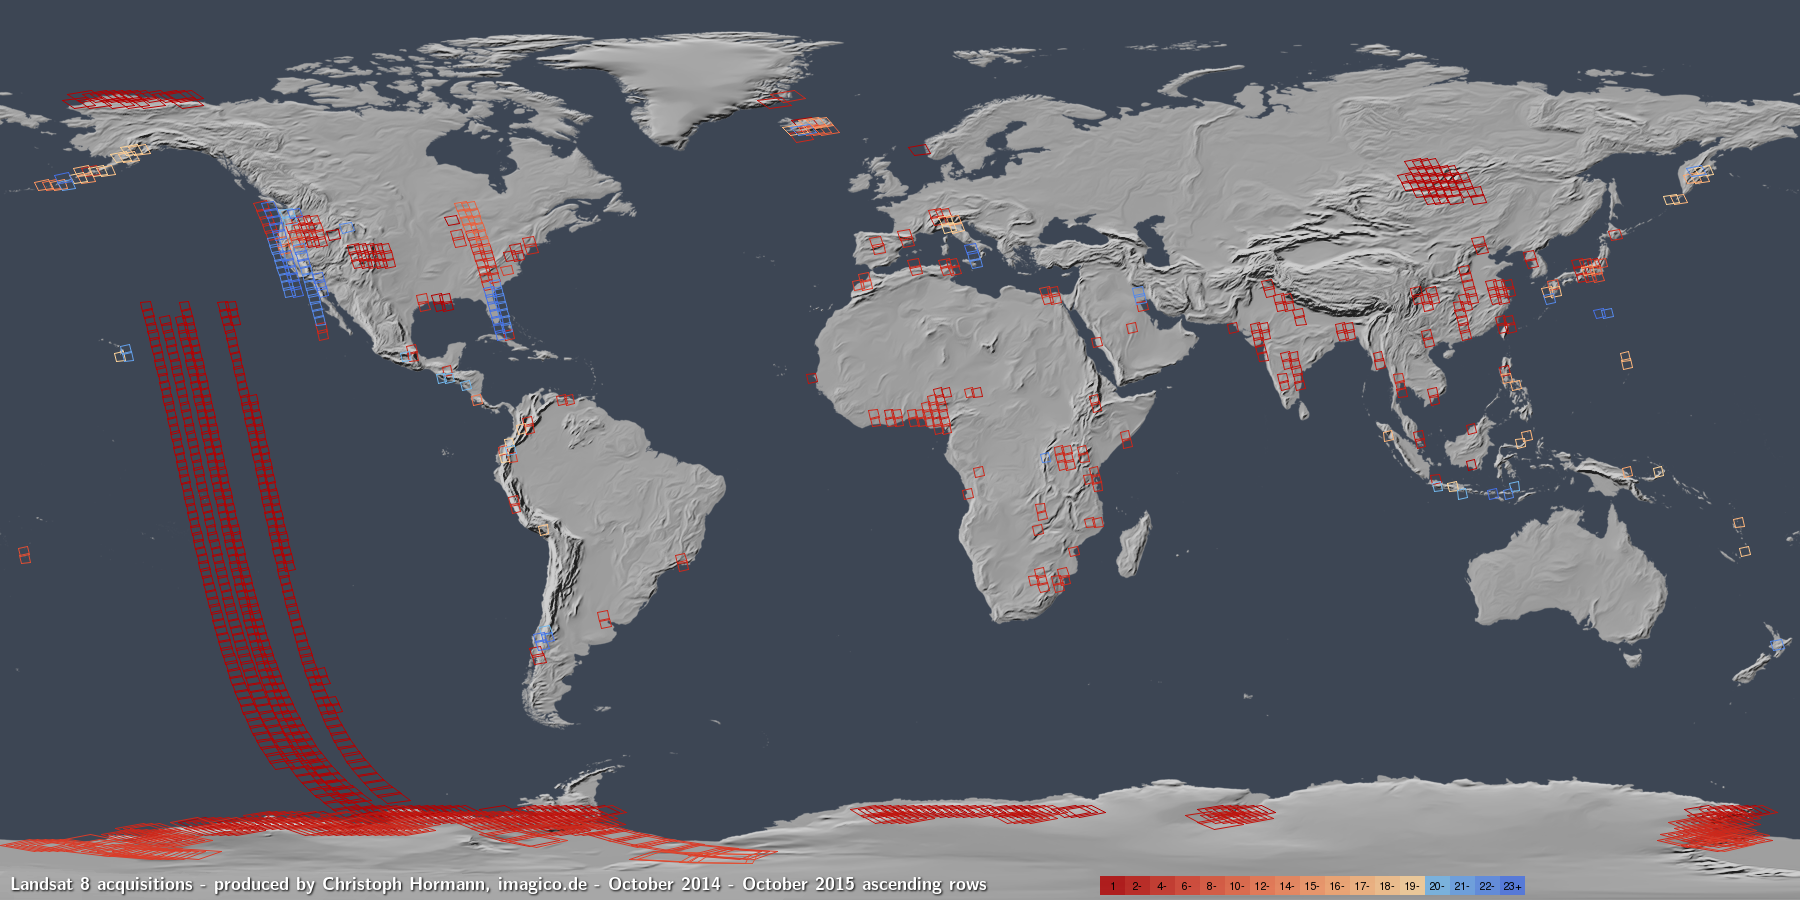
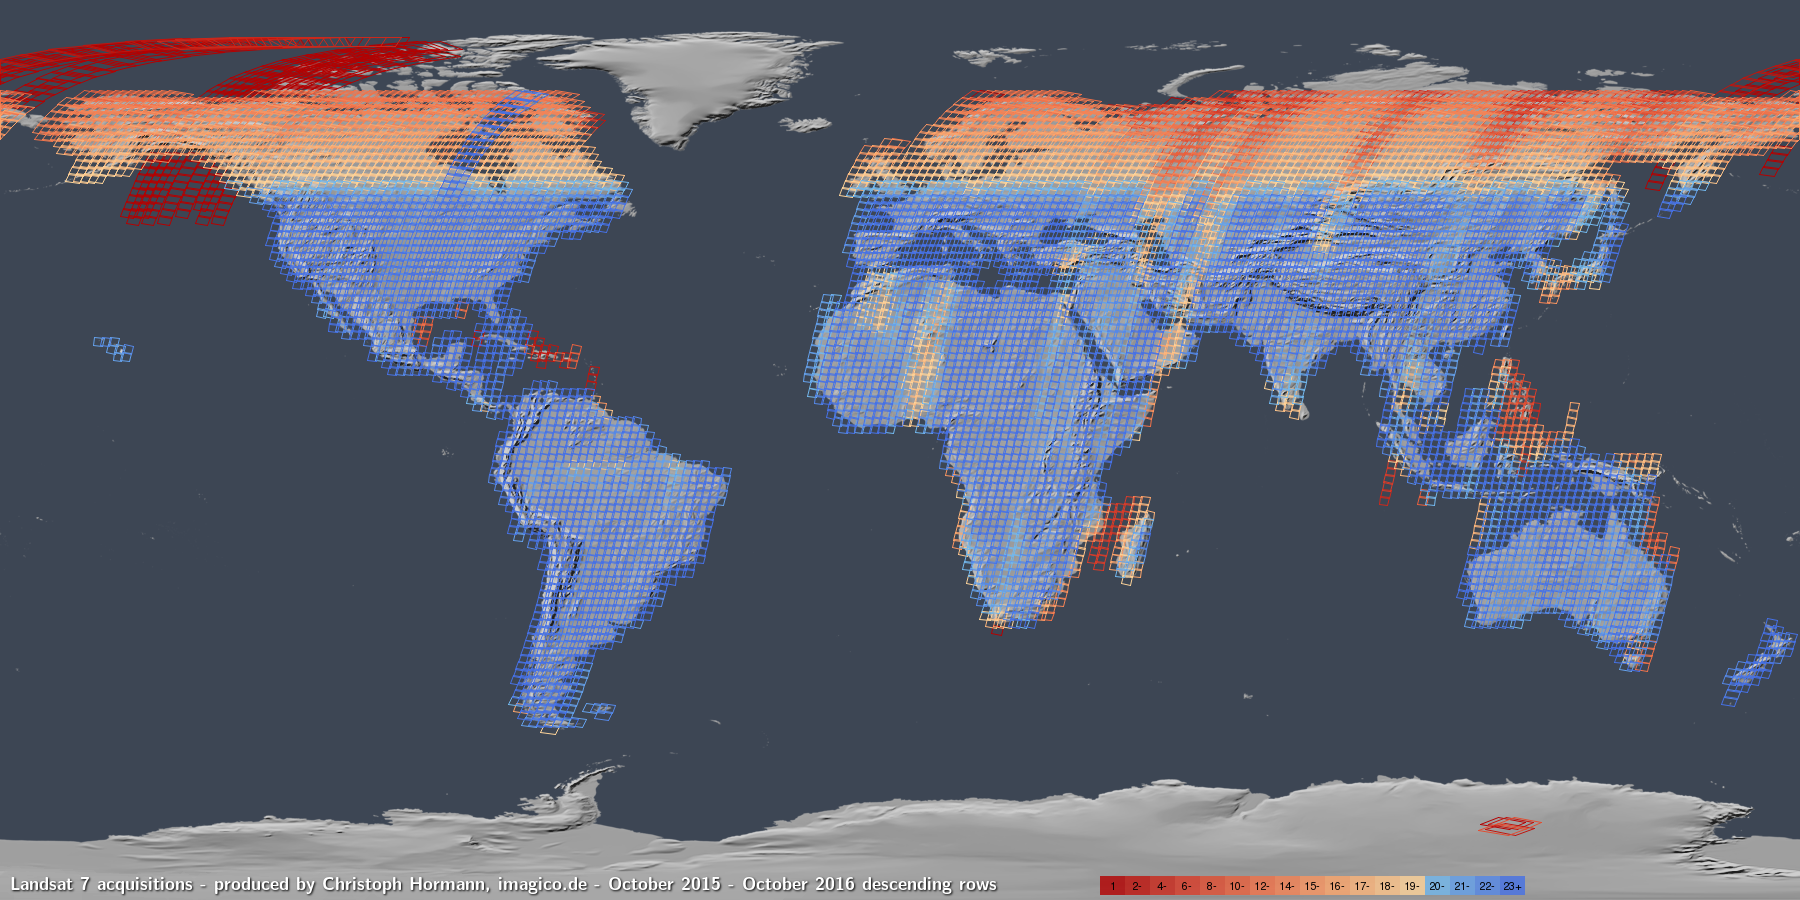
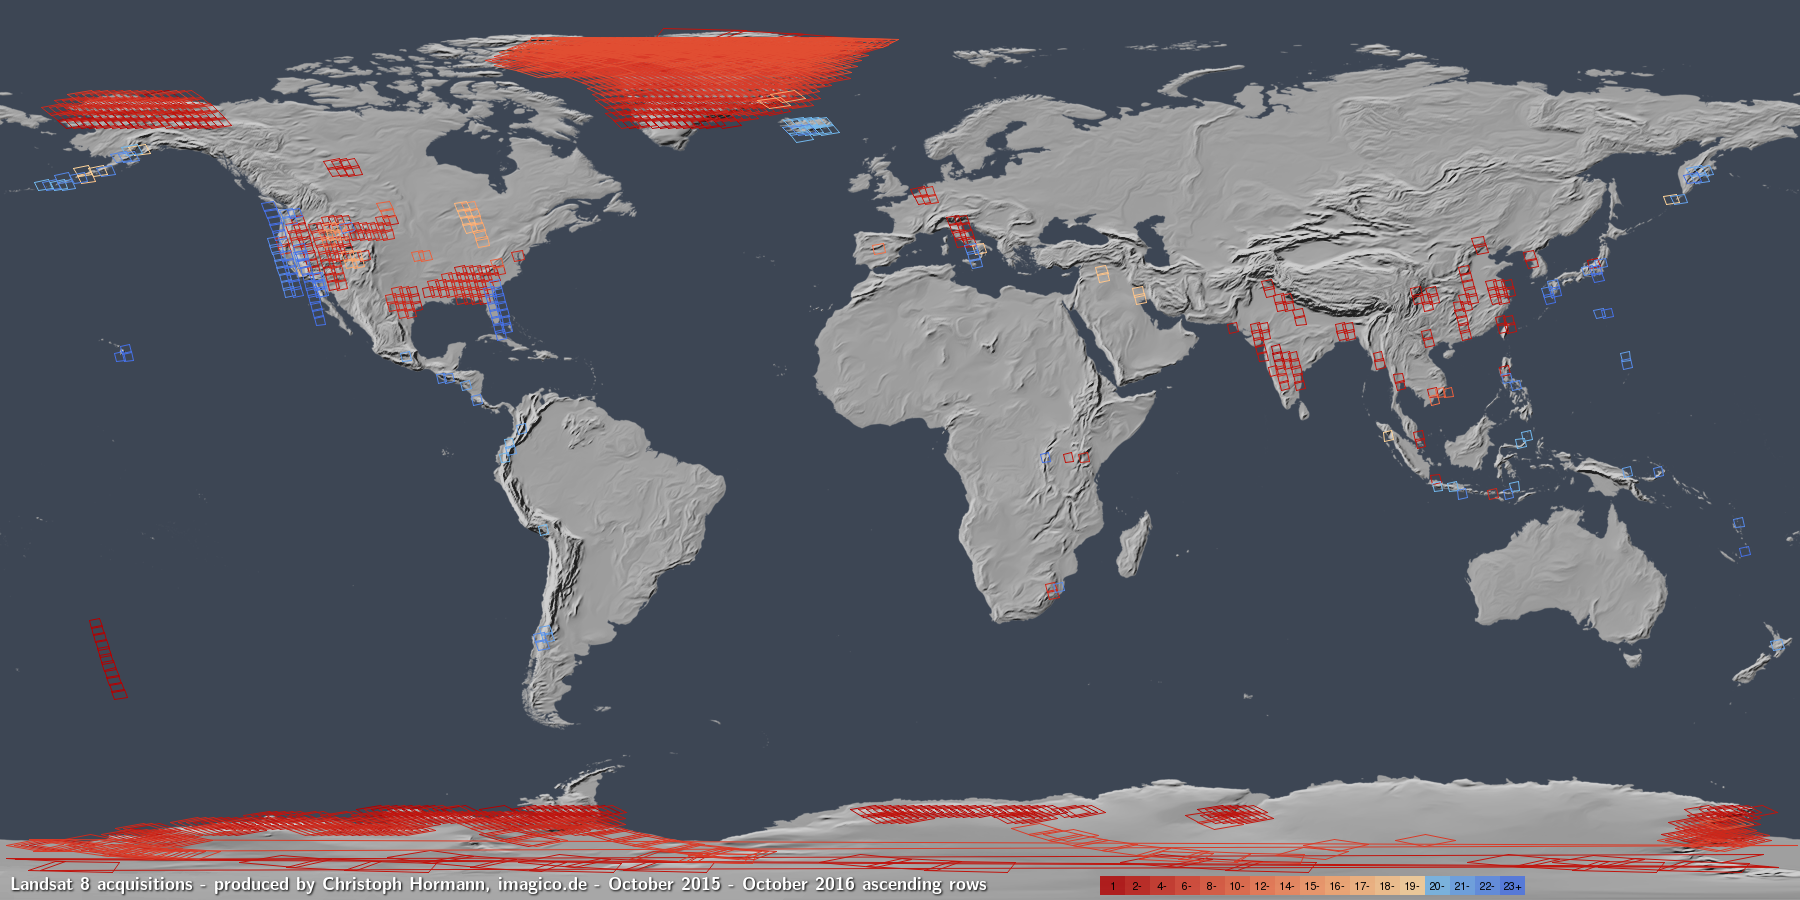
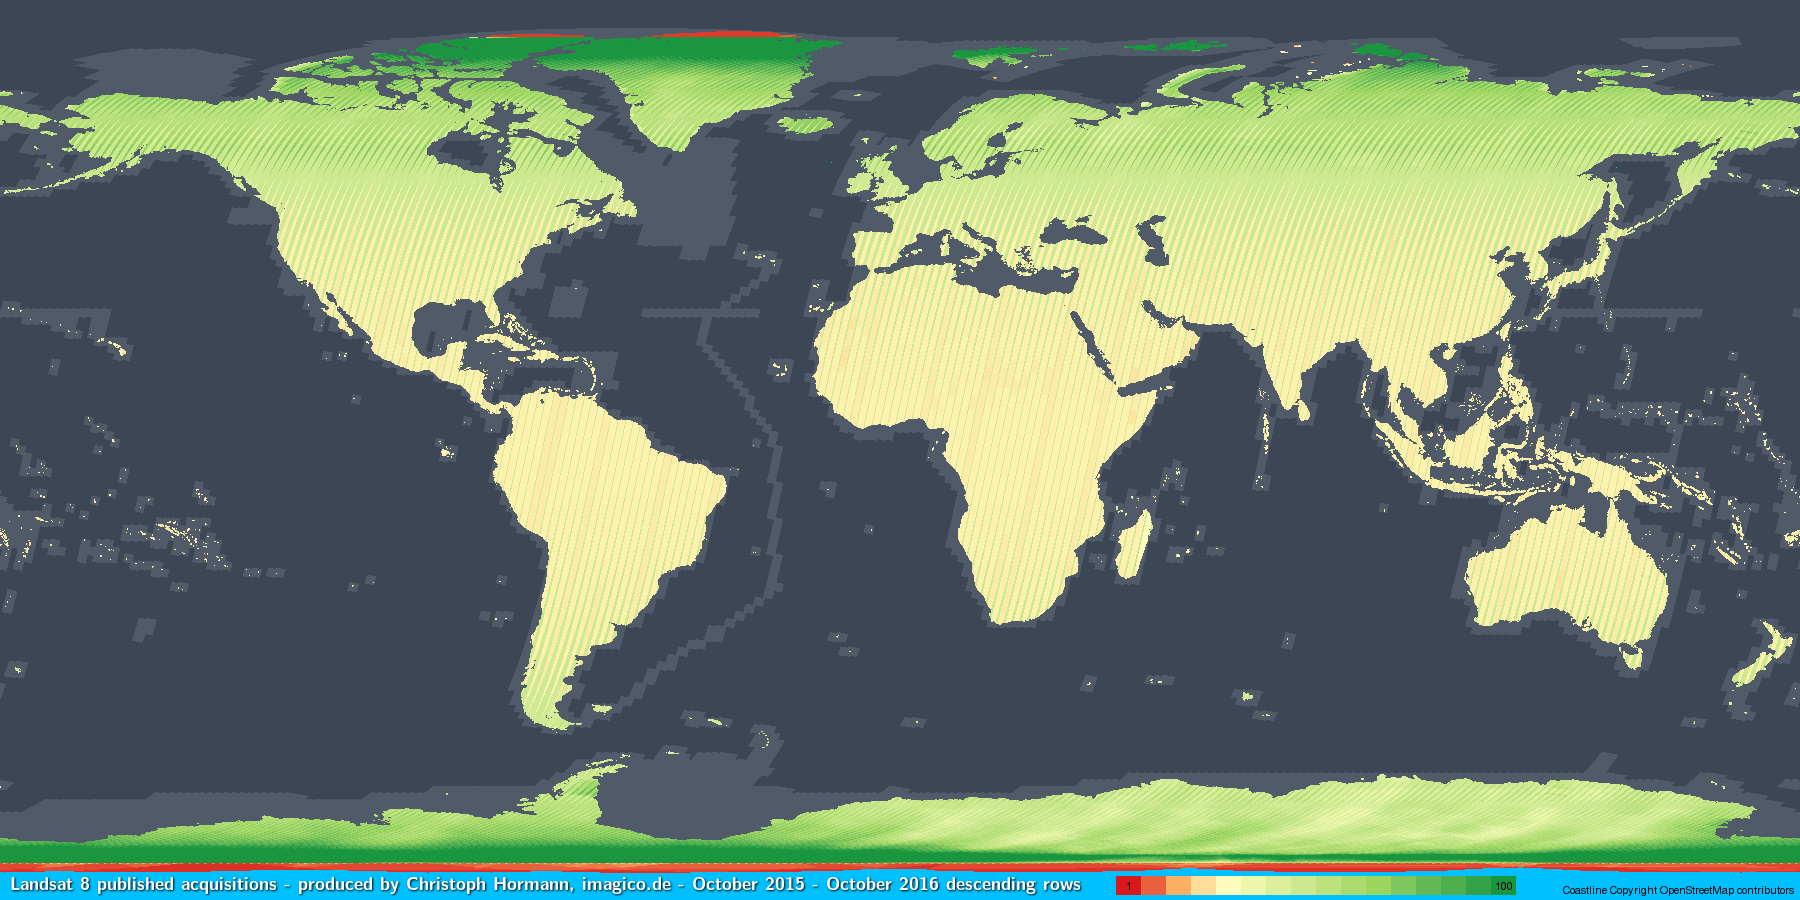
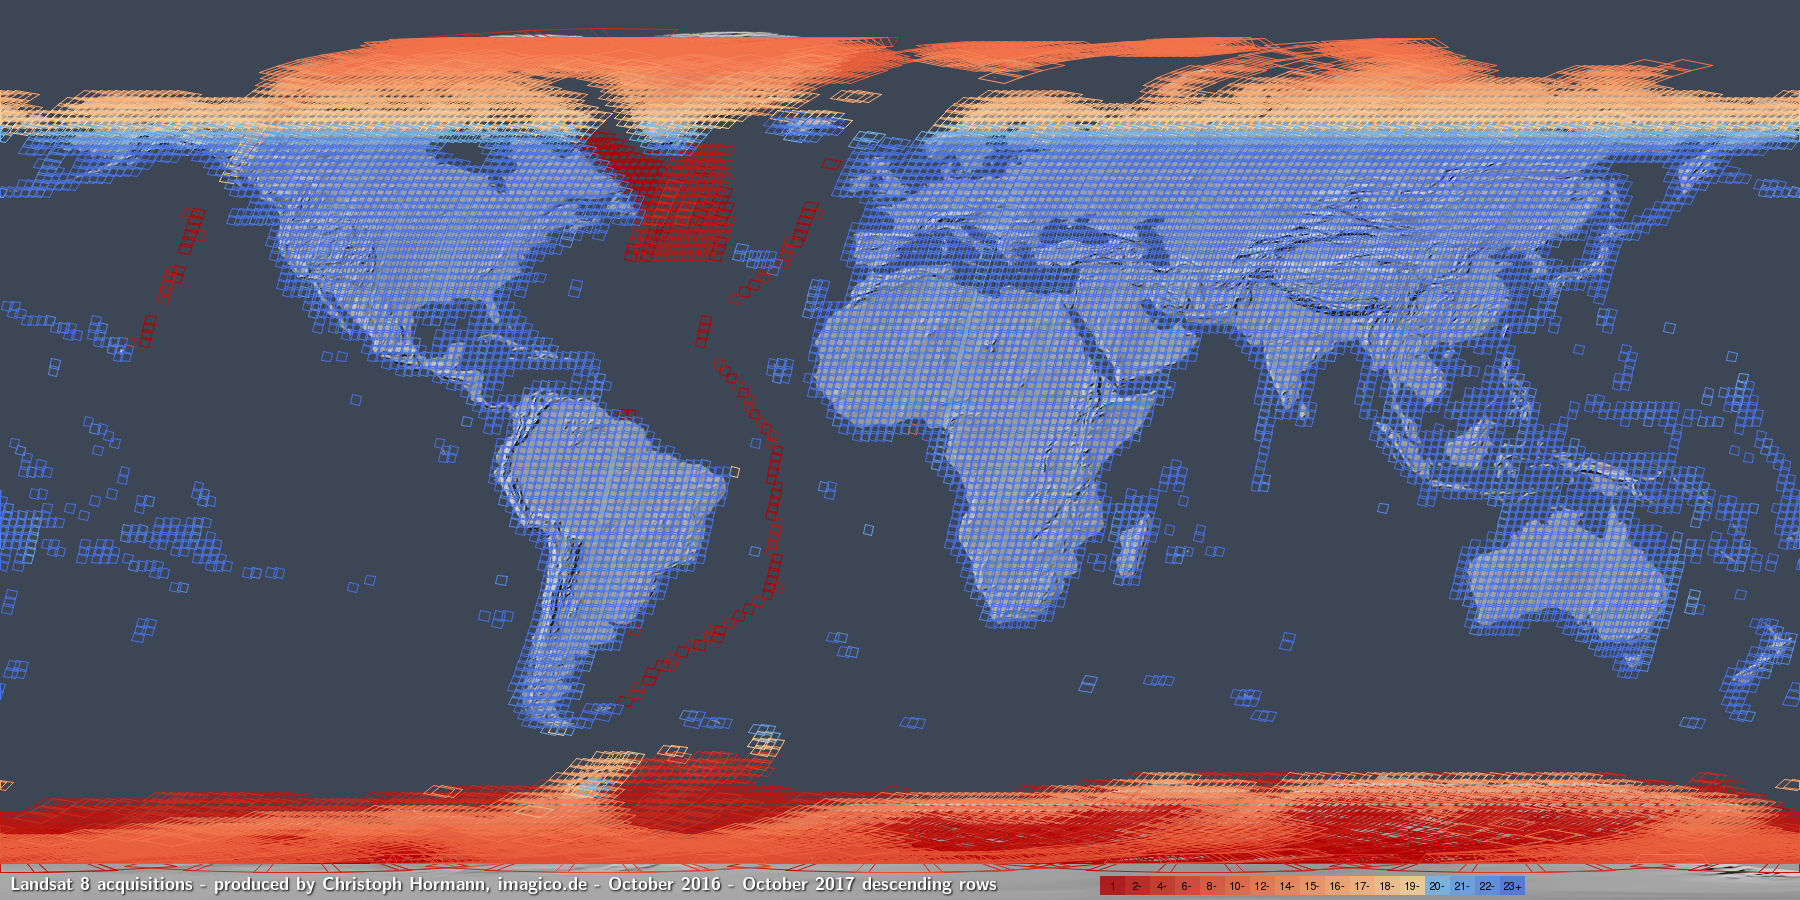
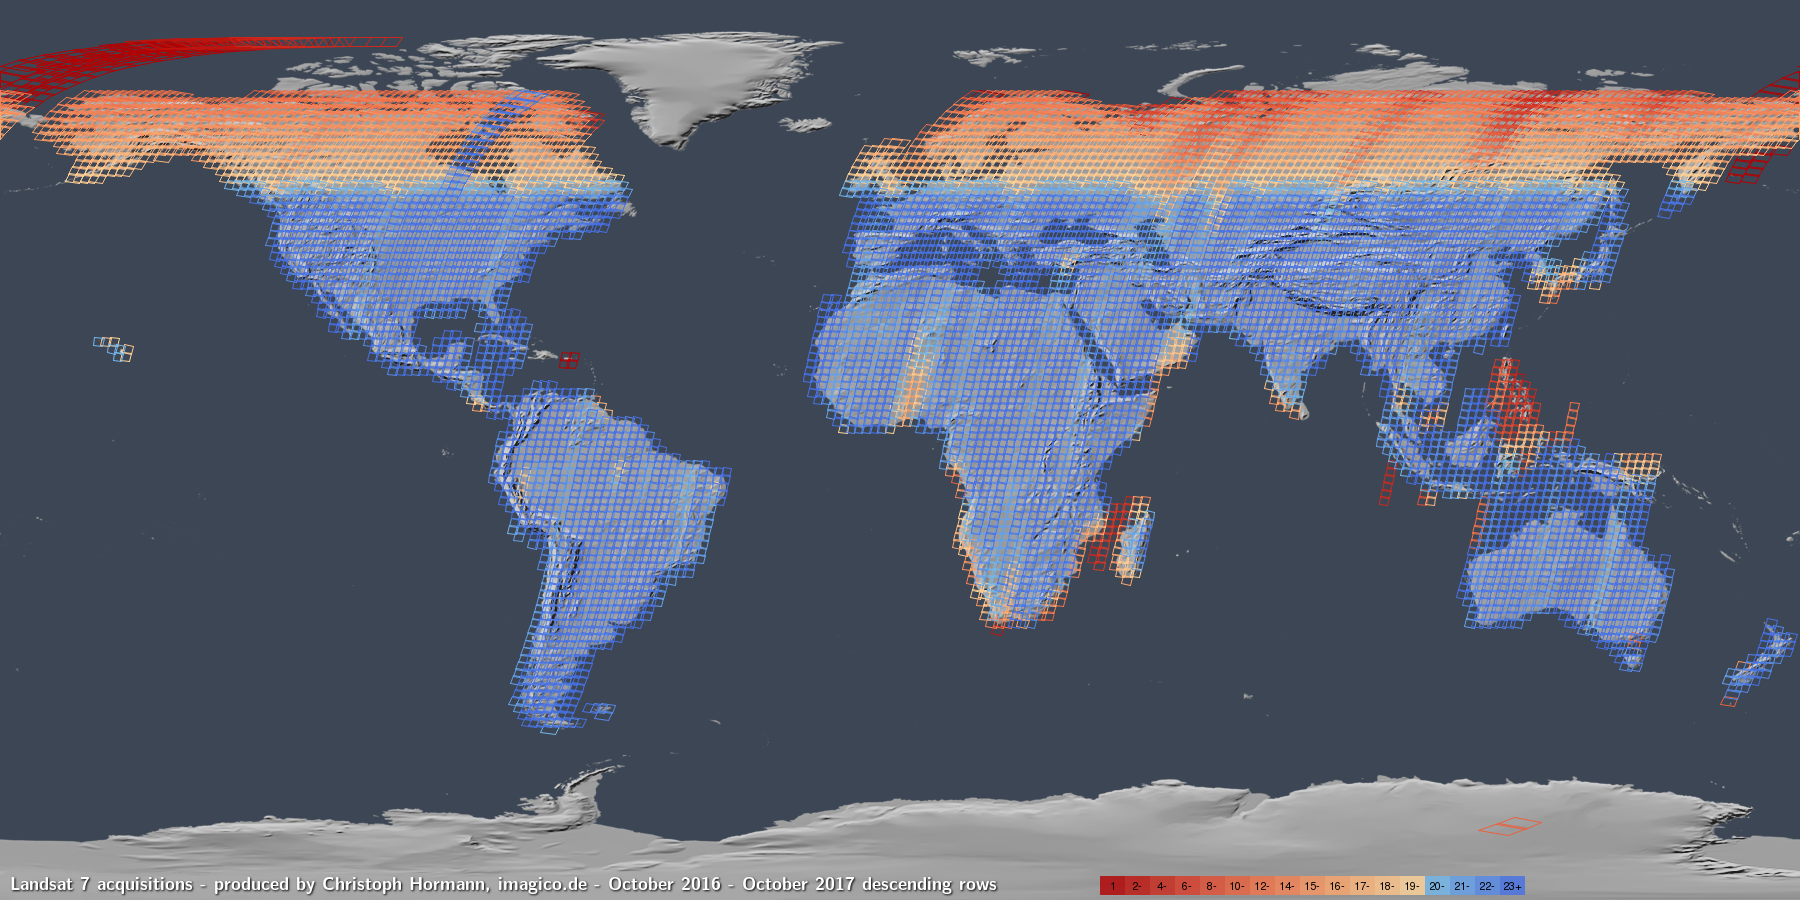
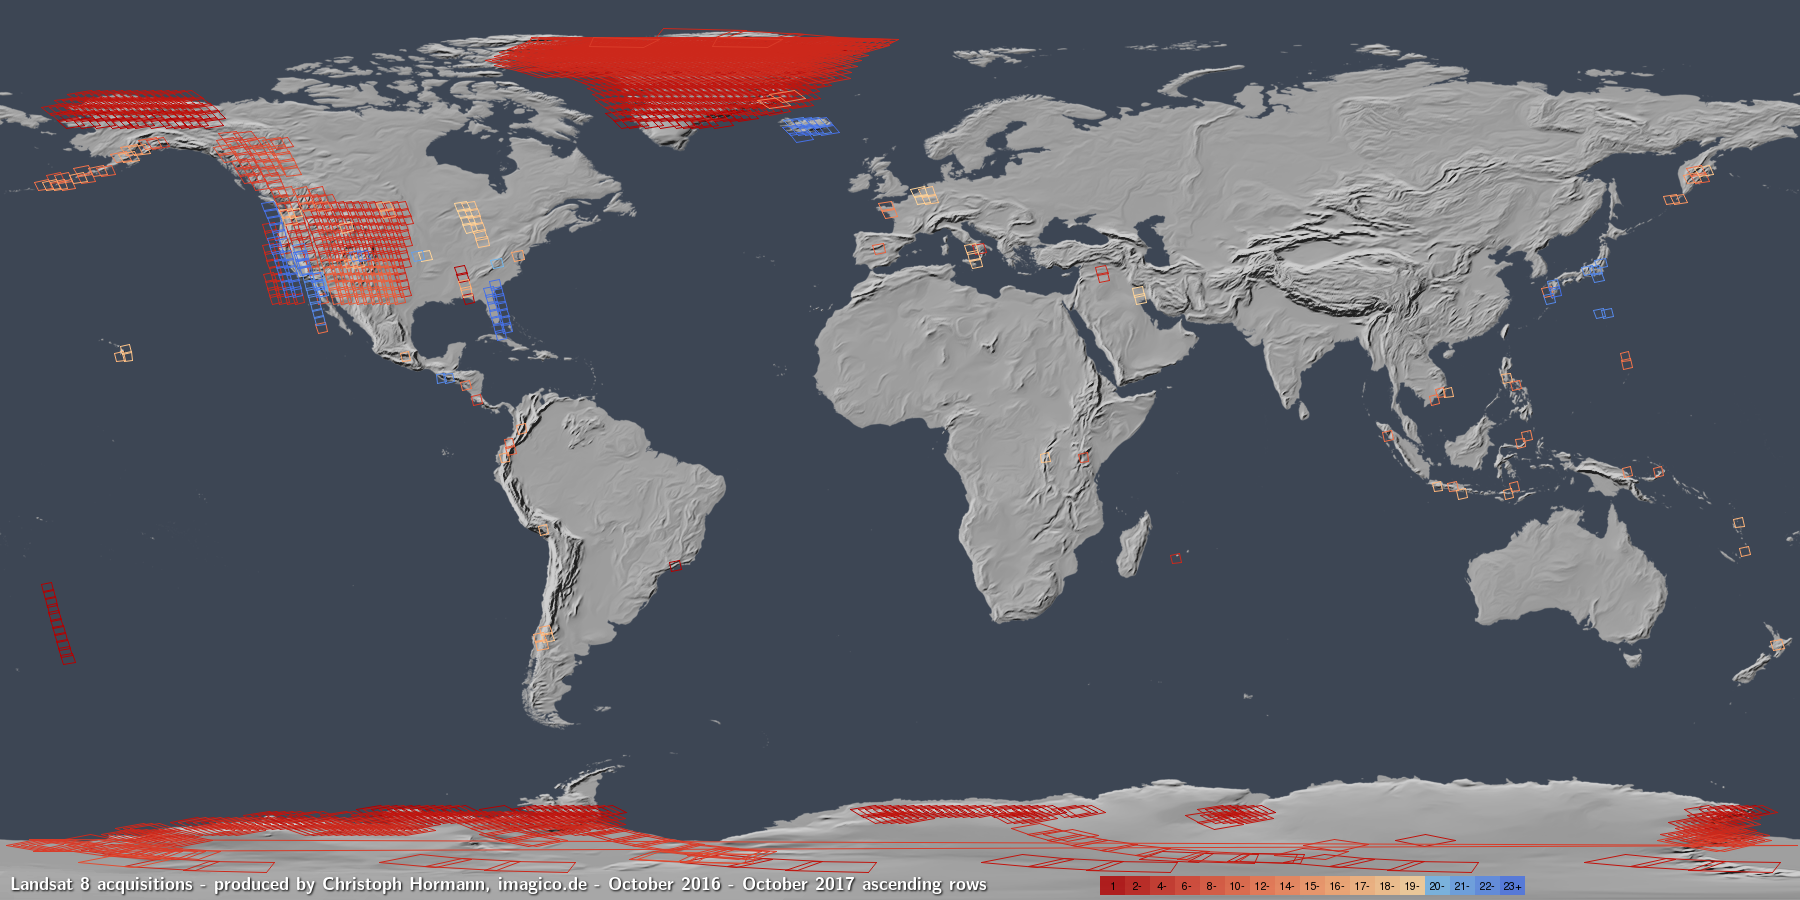
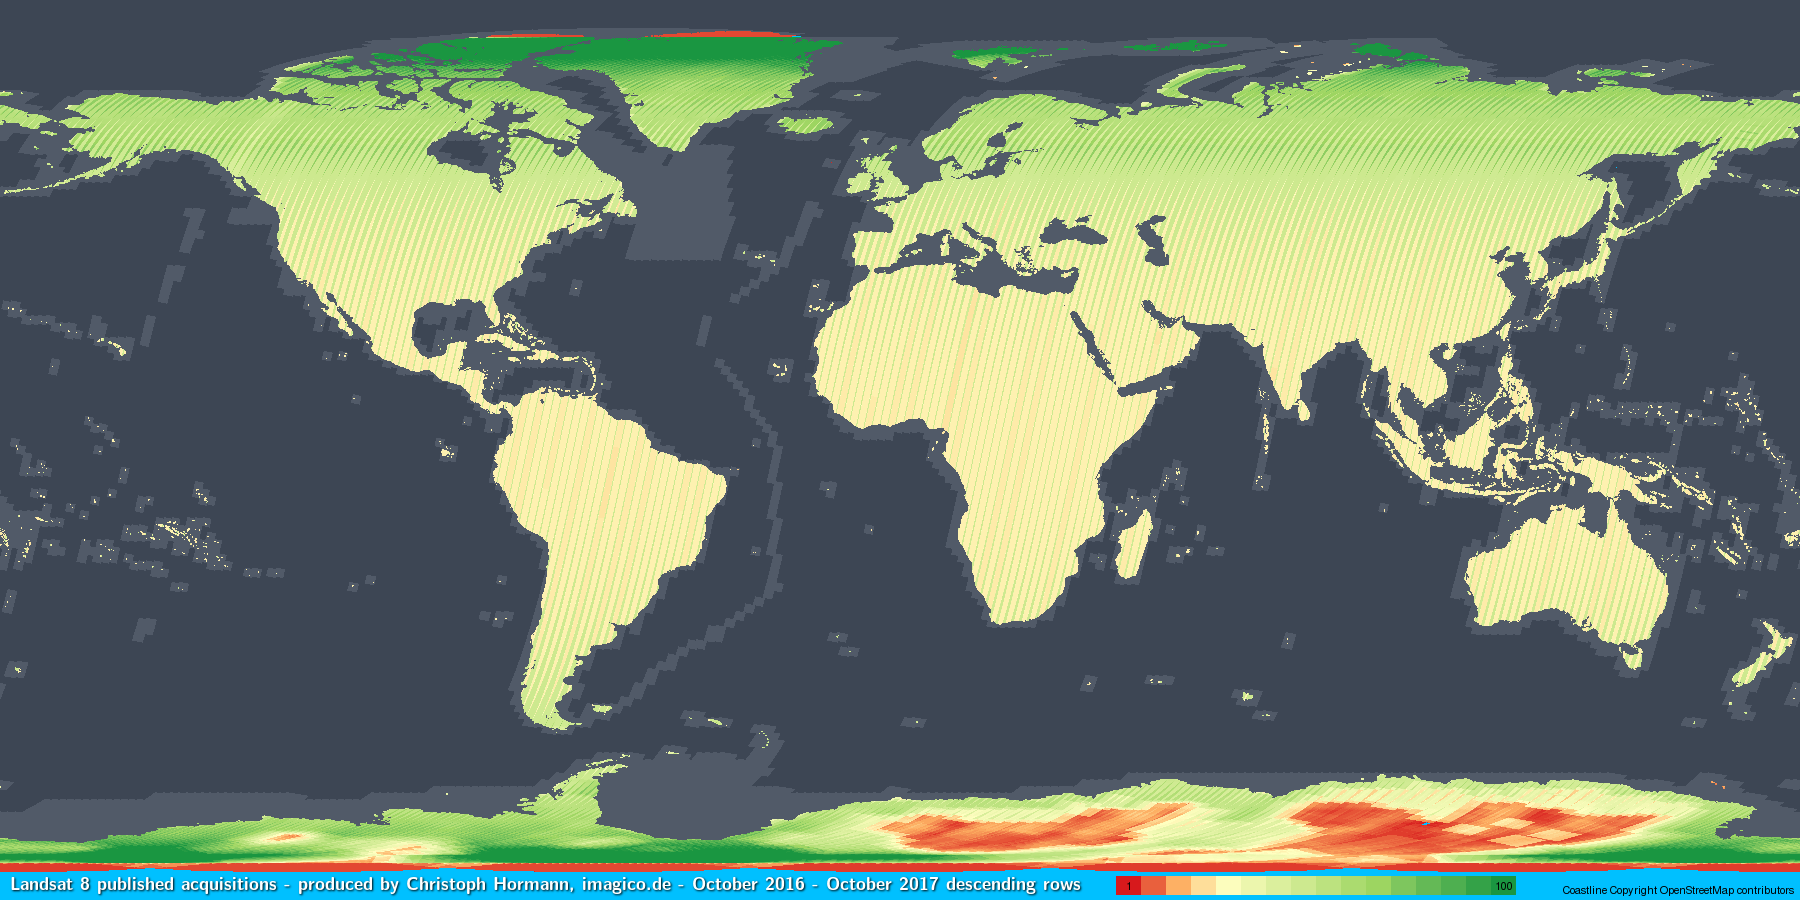
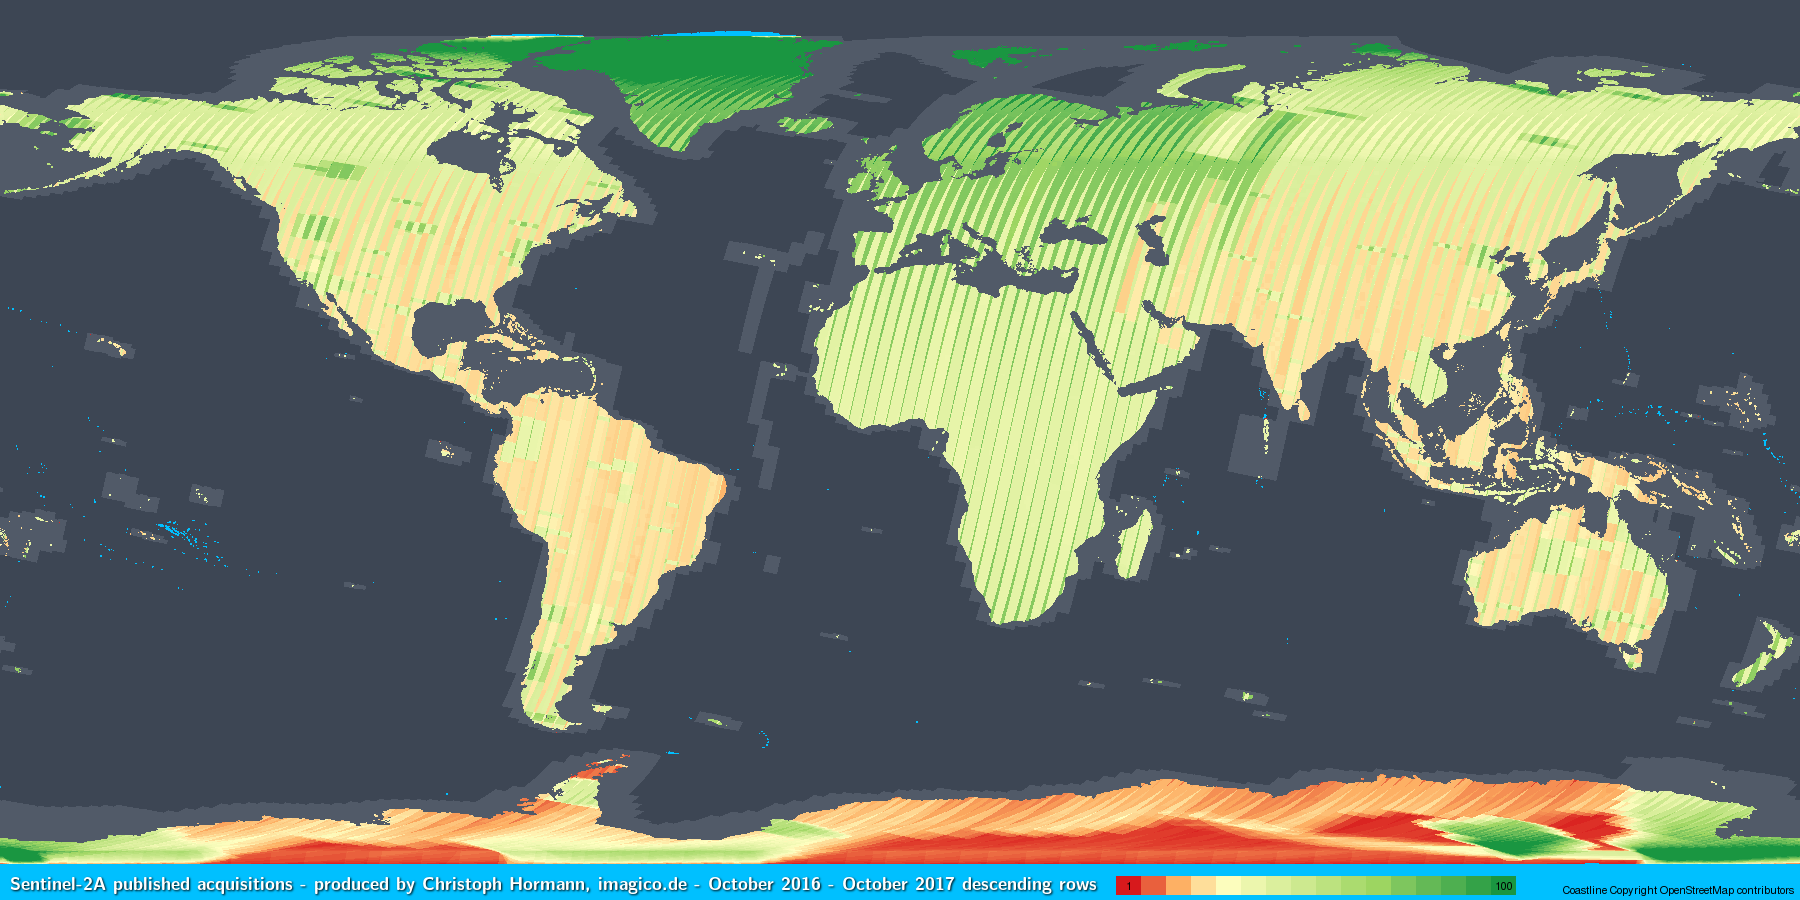
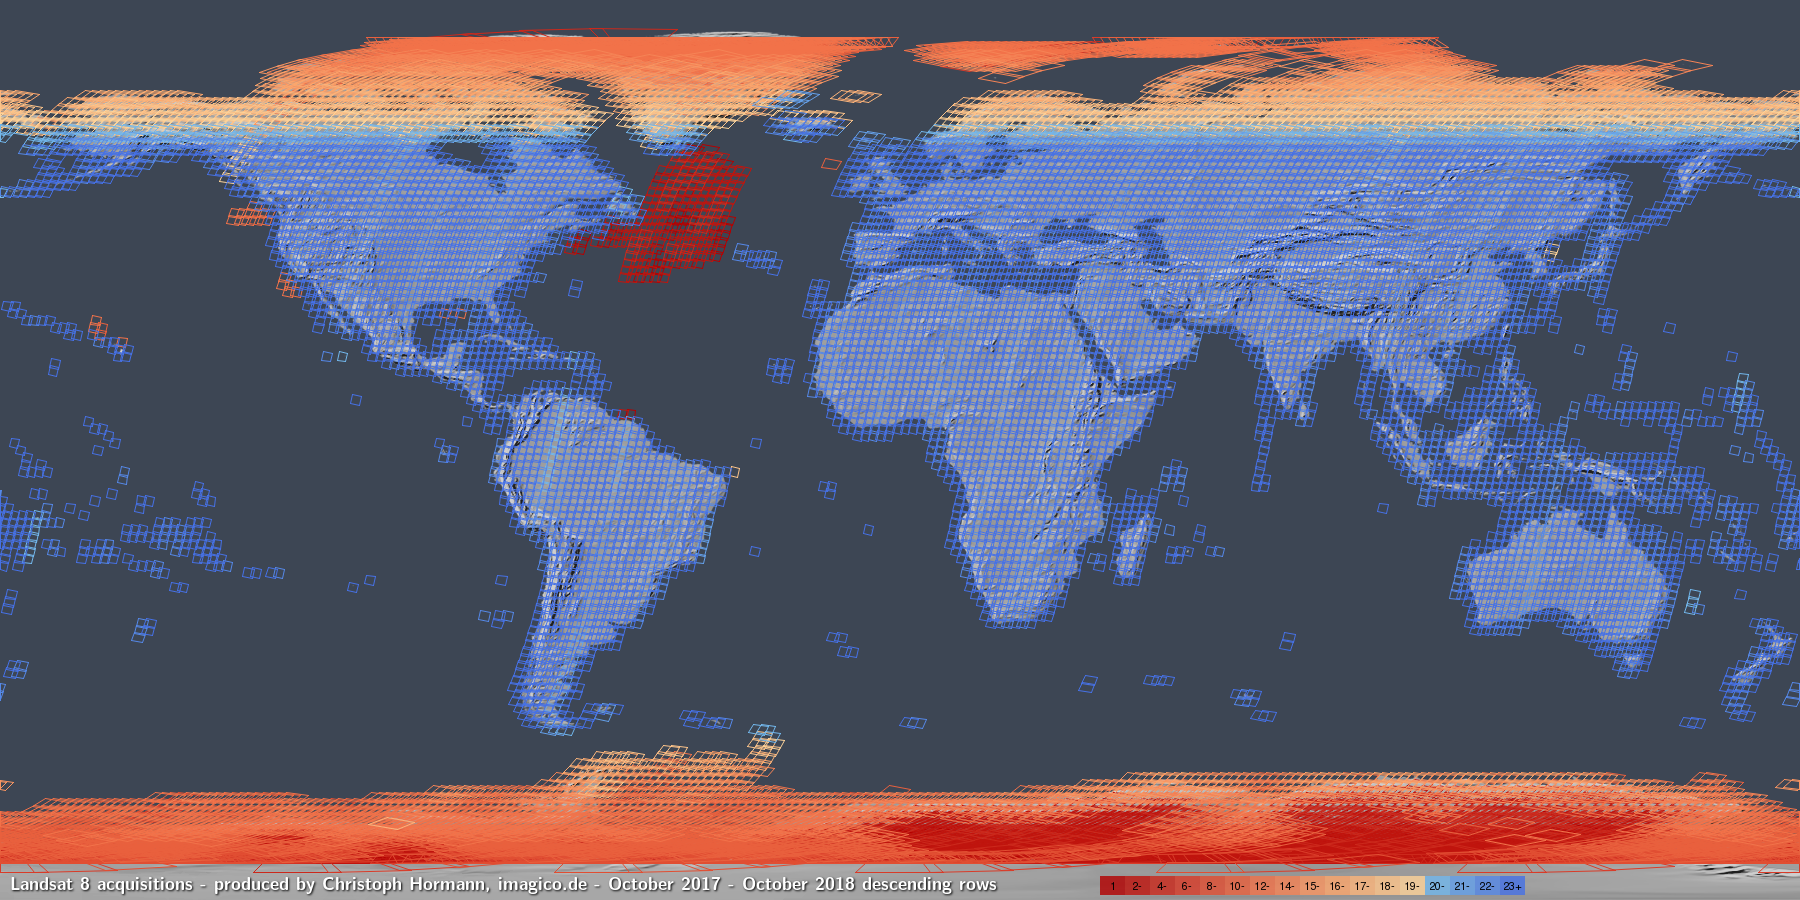
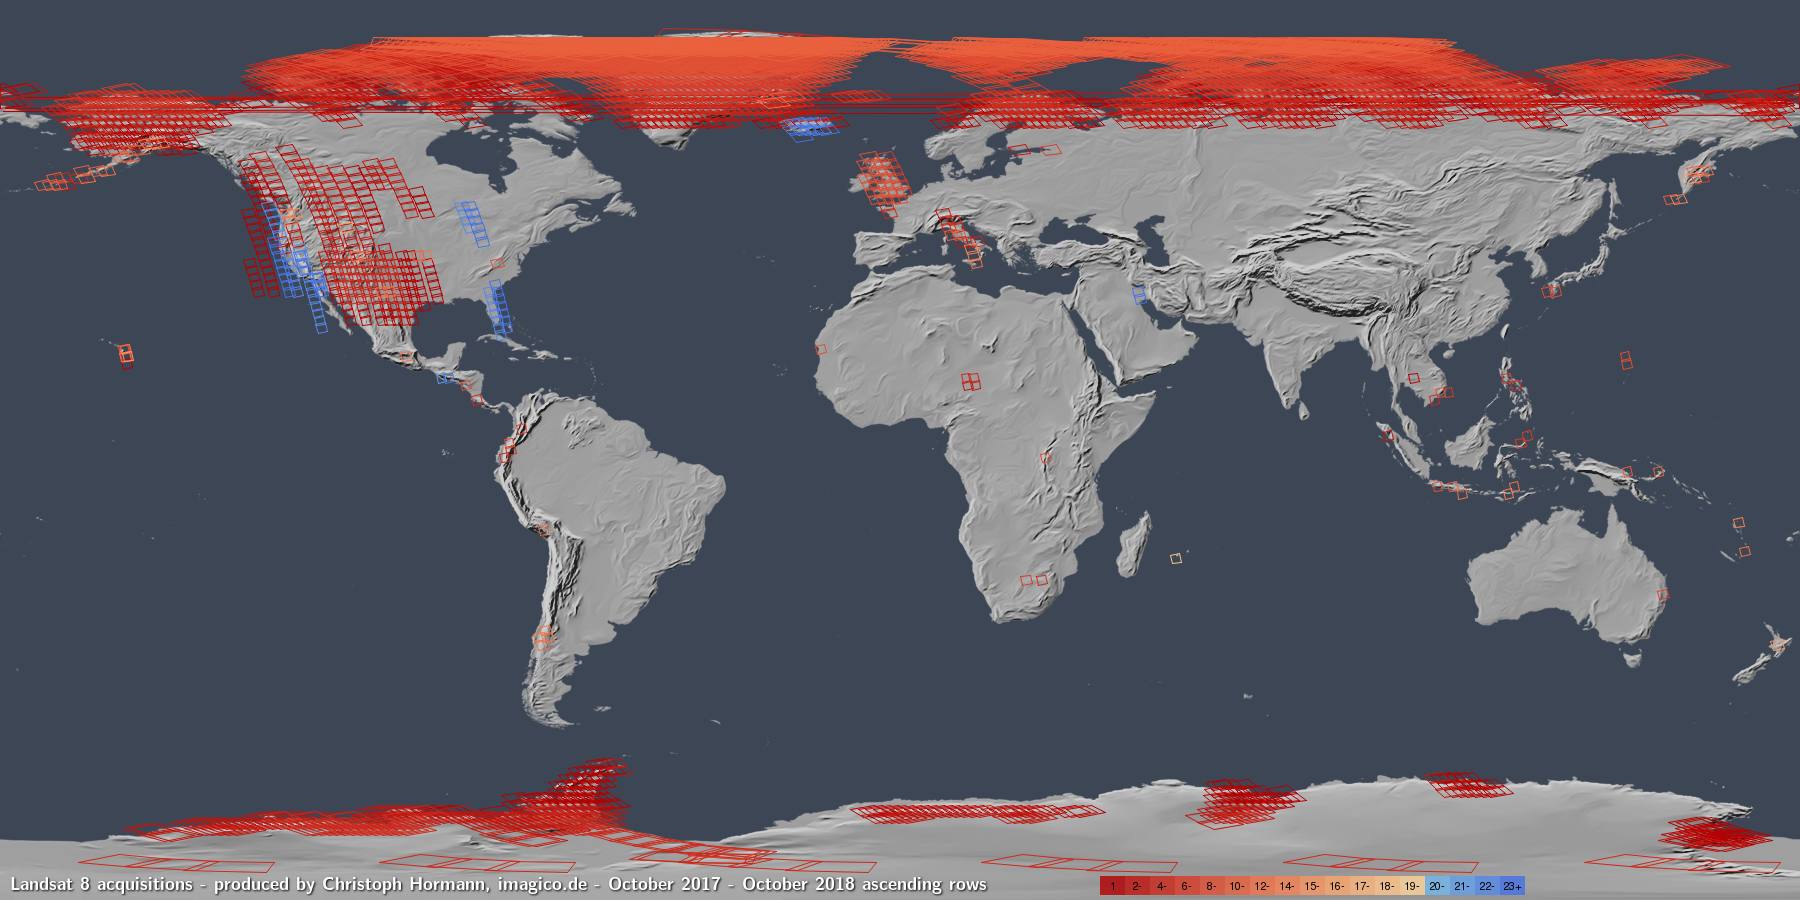
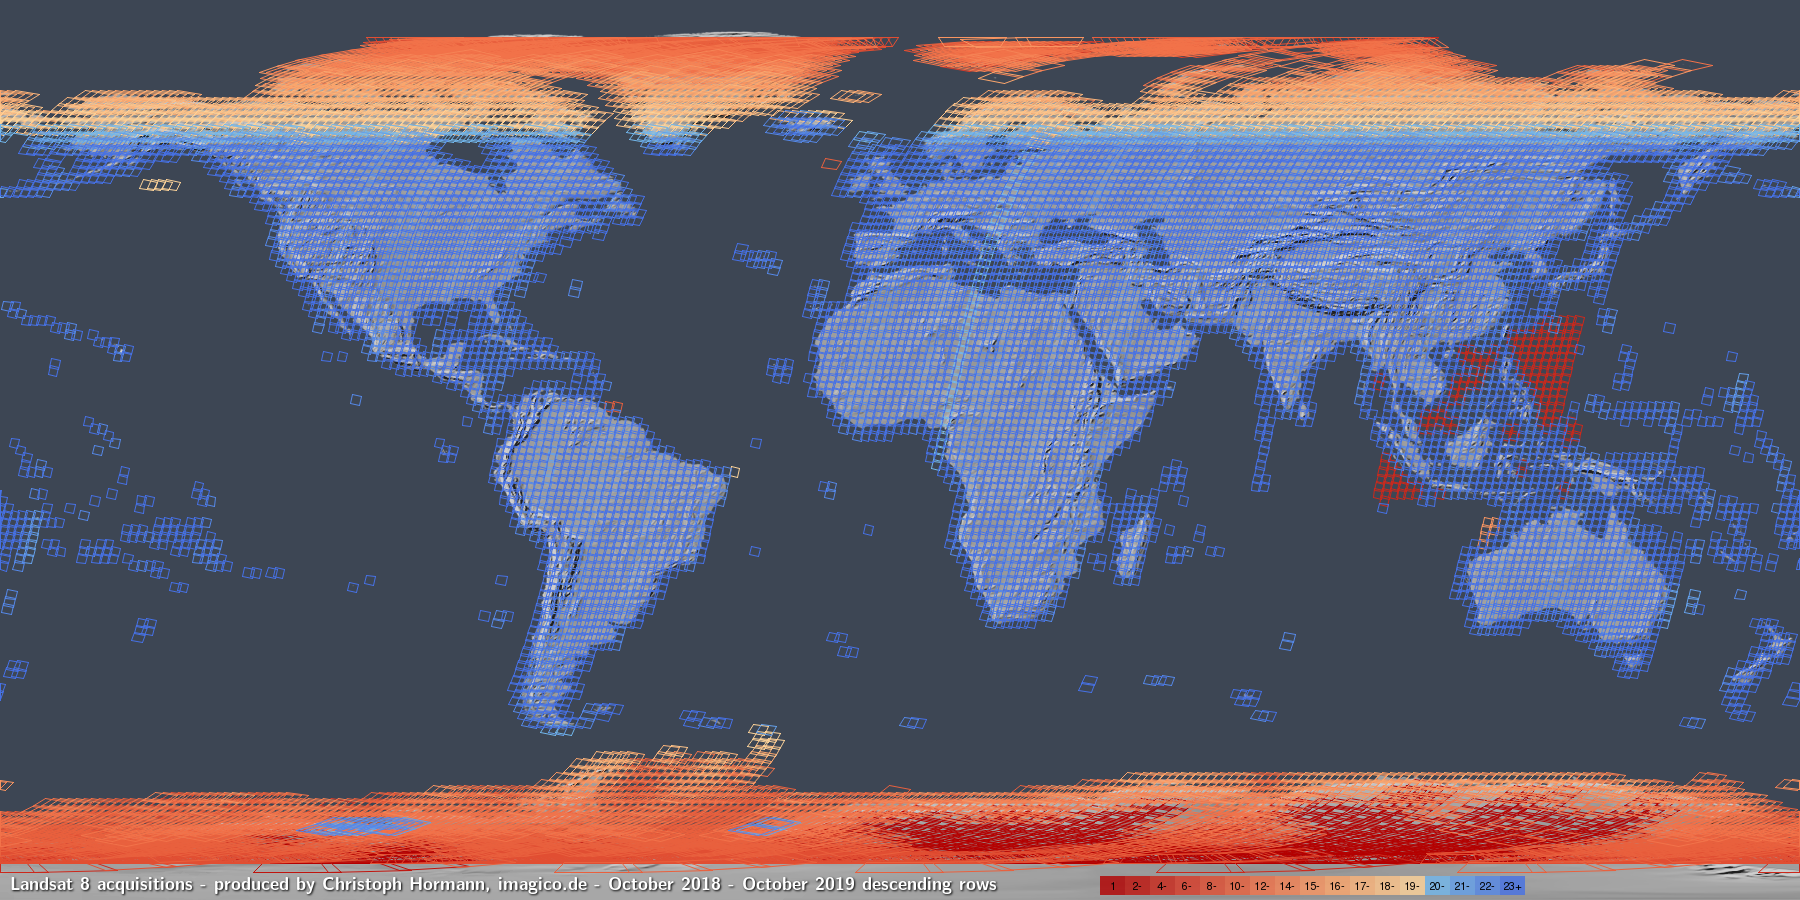
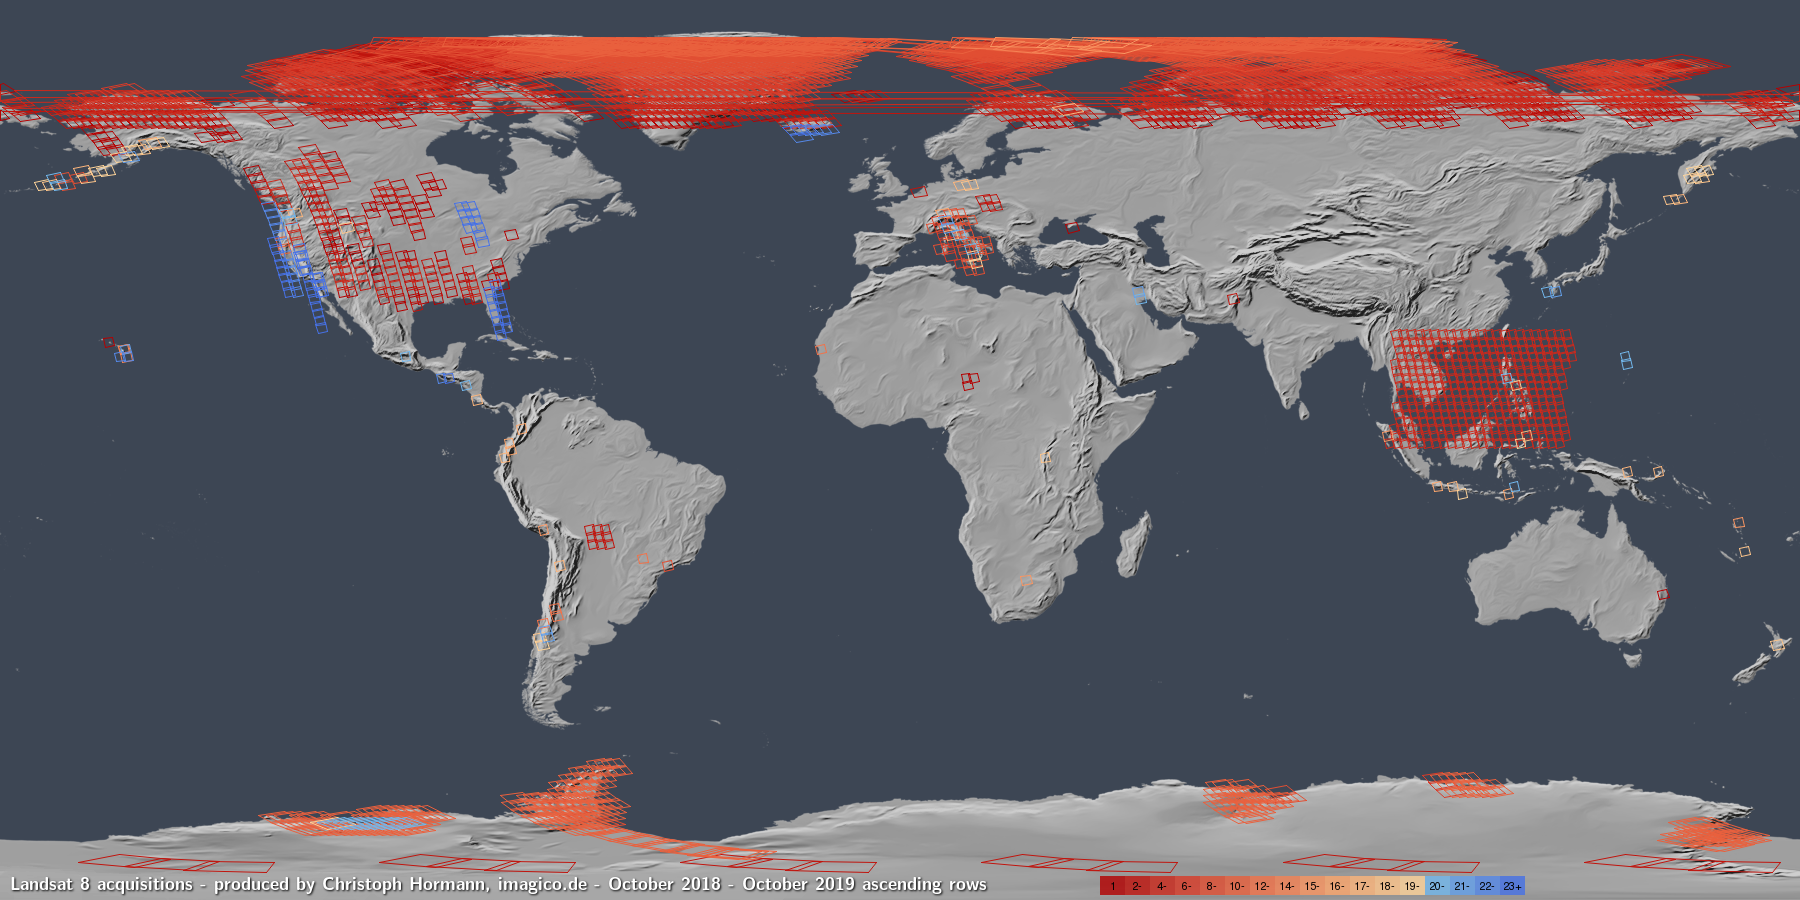
What has unfortunately also been kept the same as last year is that both Landsat and Sentinel-2 are recording significantly below capacity during the southern hemisphere summer by recording the Antarctic only partially or at reduced frequency. In fact for Landsat this has been even further reduced during the 2018-2019 Antarctic summer compared to the year before. In addition, the USGS did not record any off-nadir images of northern Greenland during last summer – for the first time since 2015.
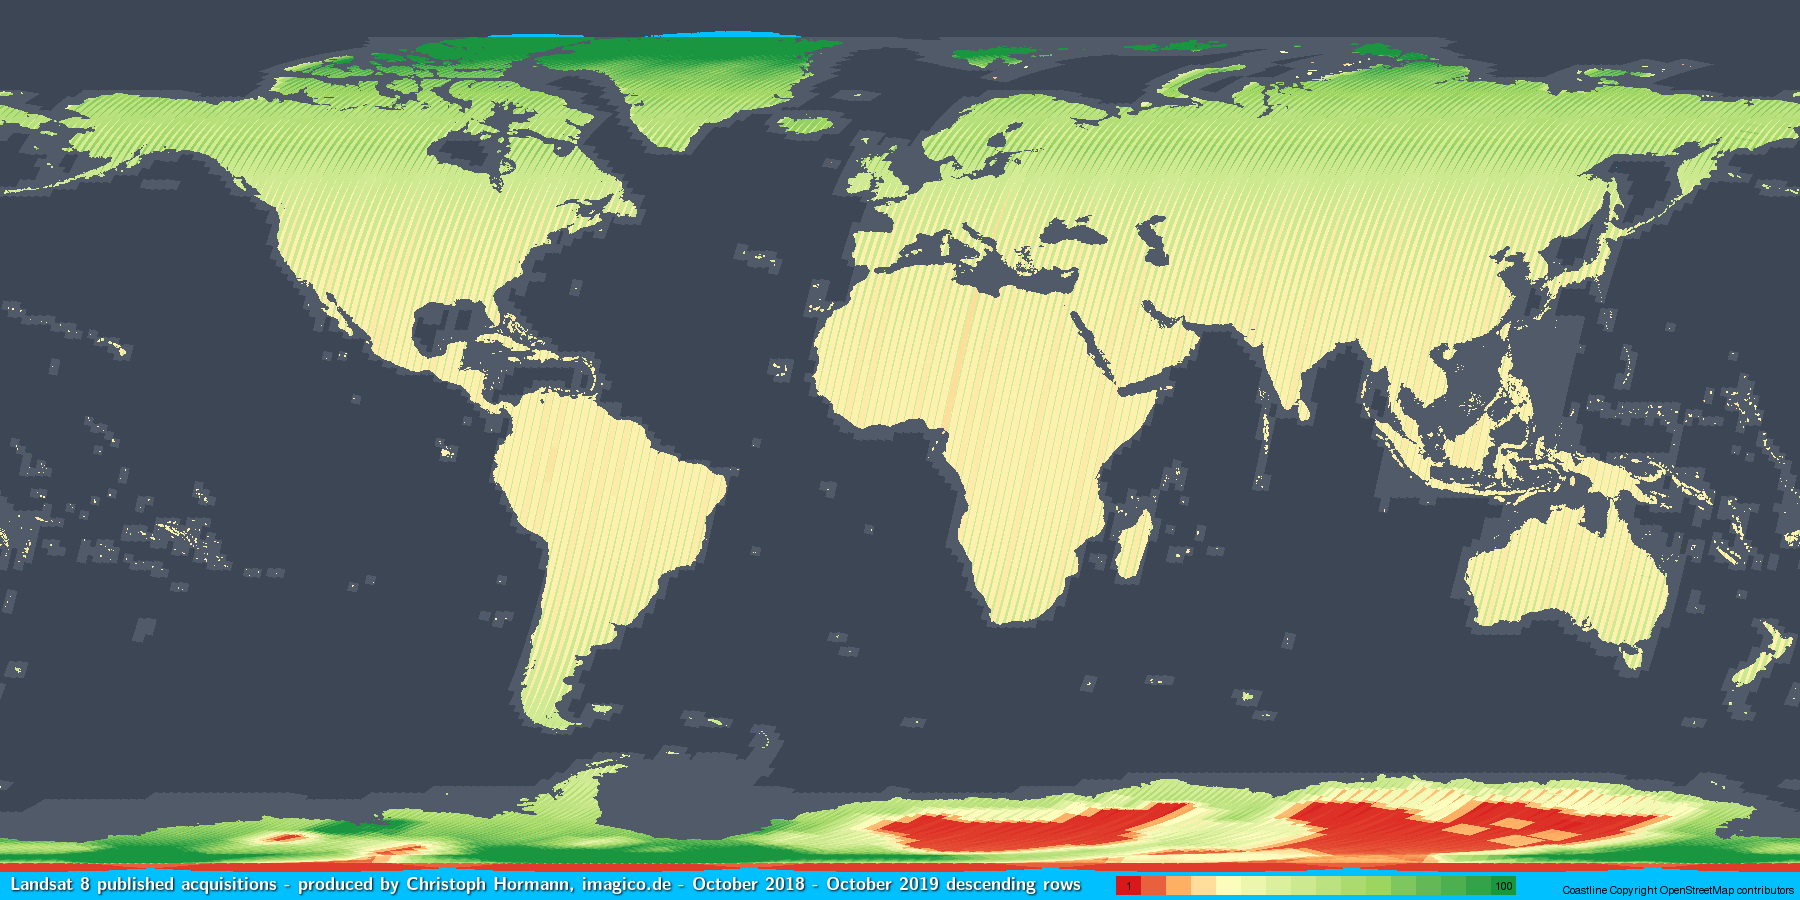
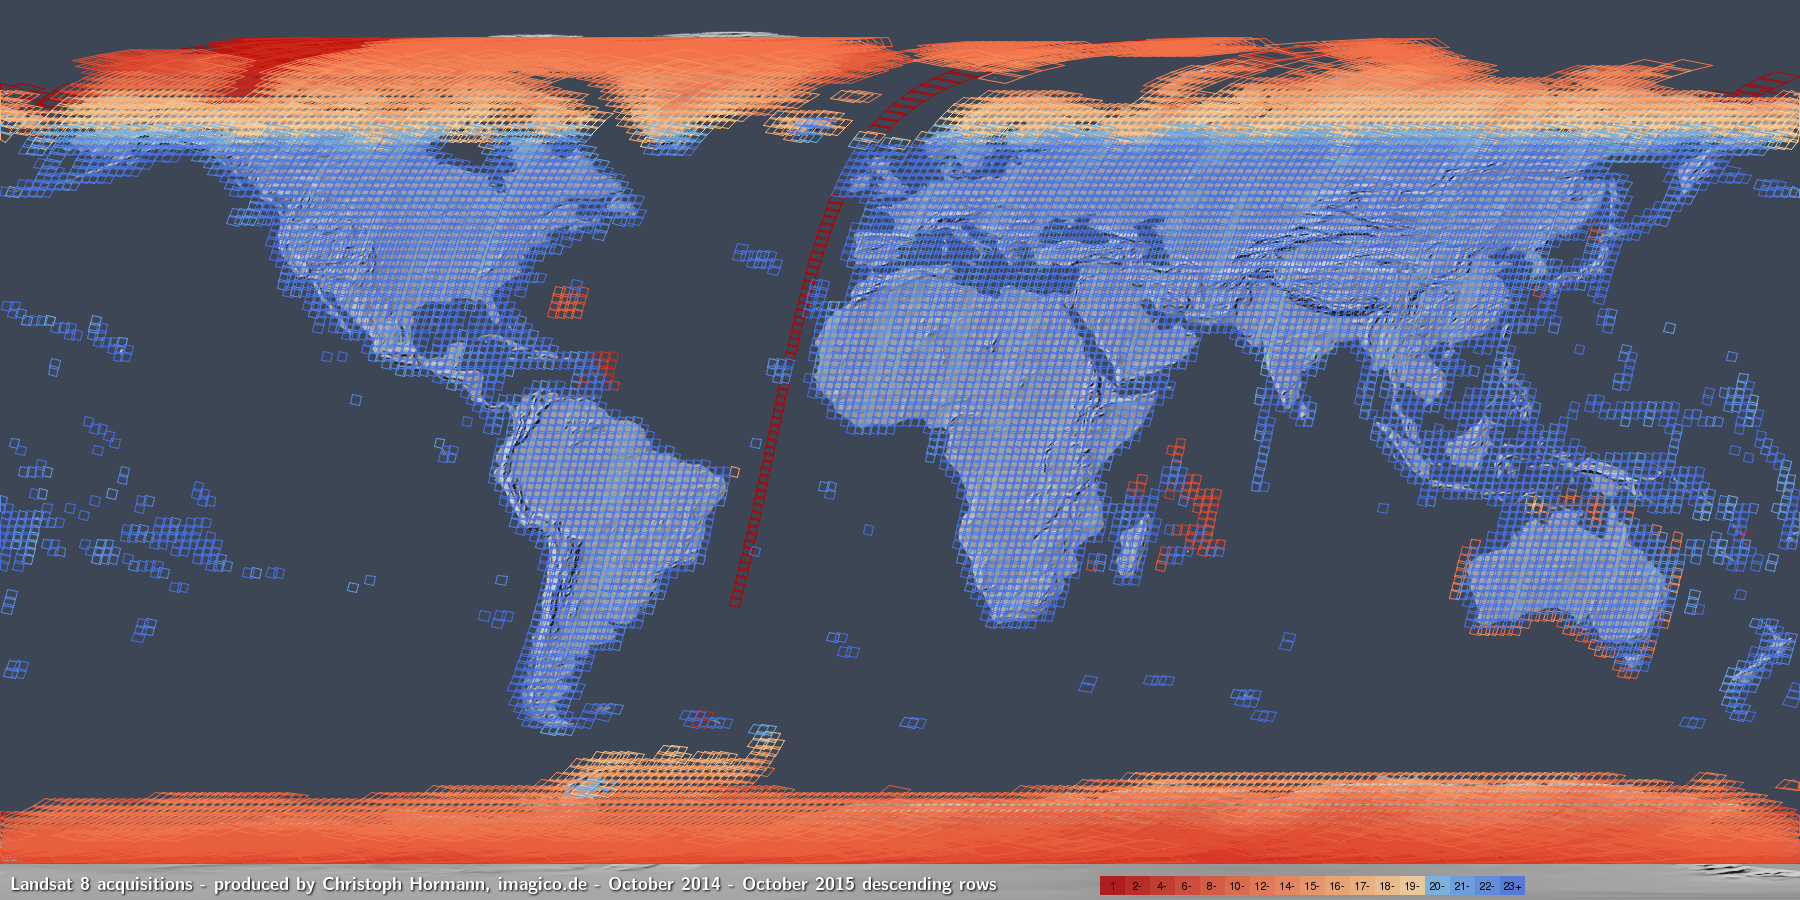
Landsat 8 2019
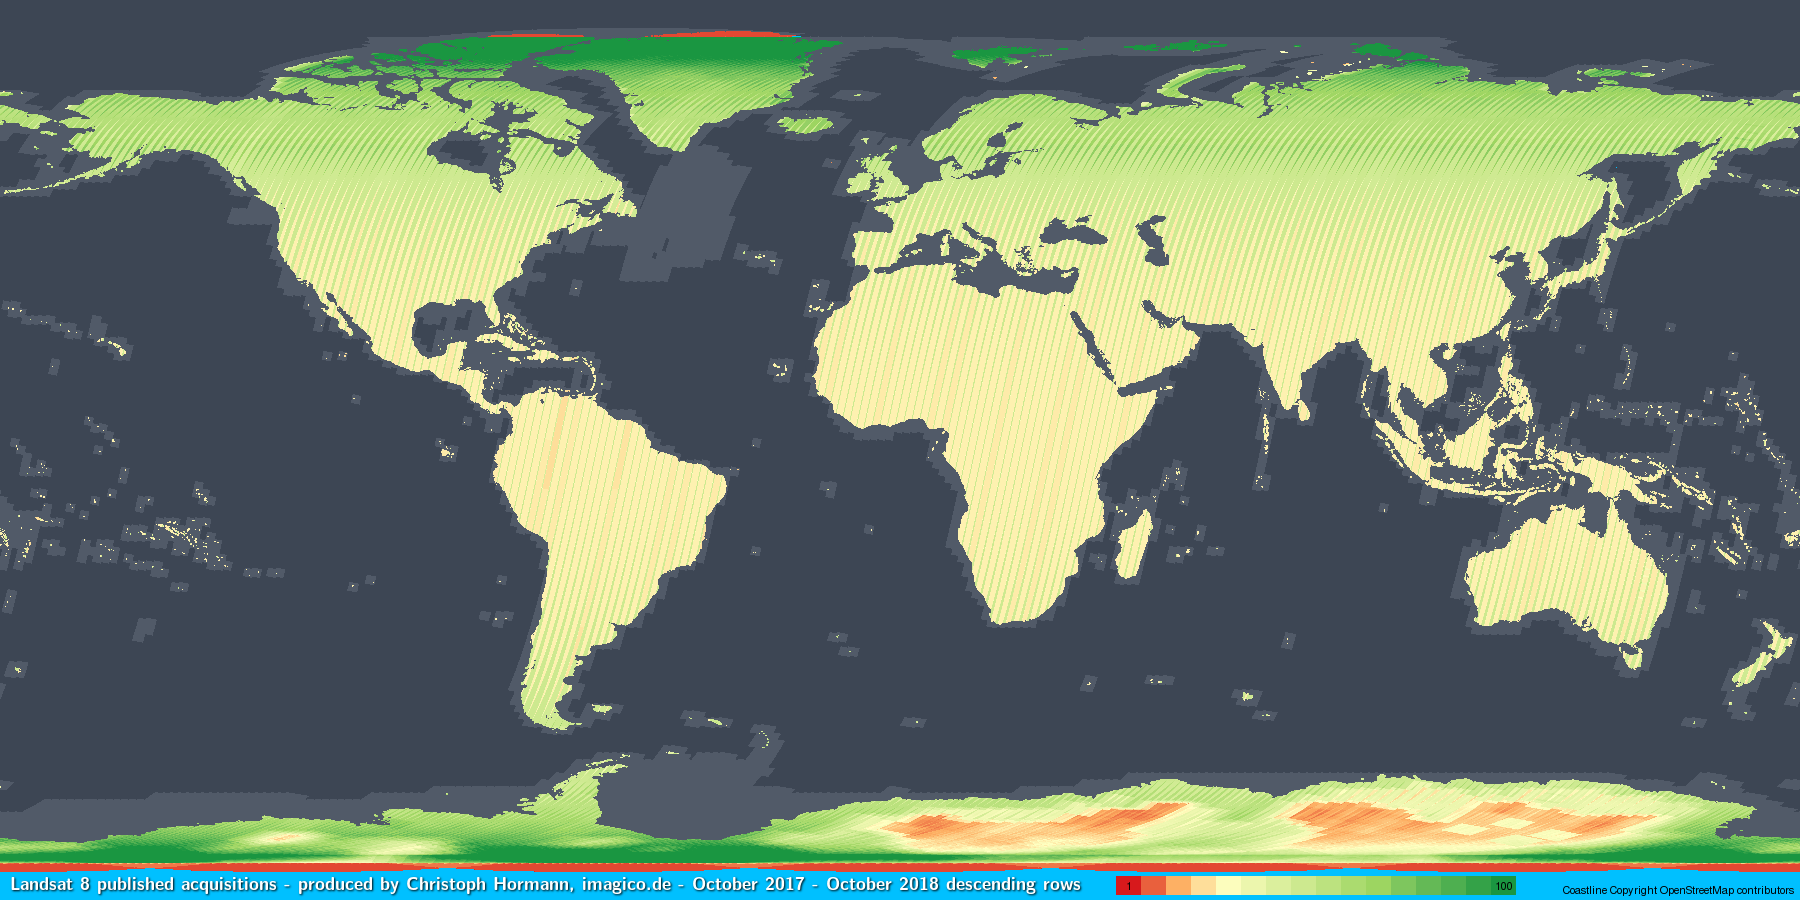
Landsat 8 2018
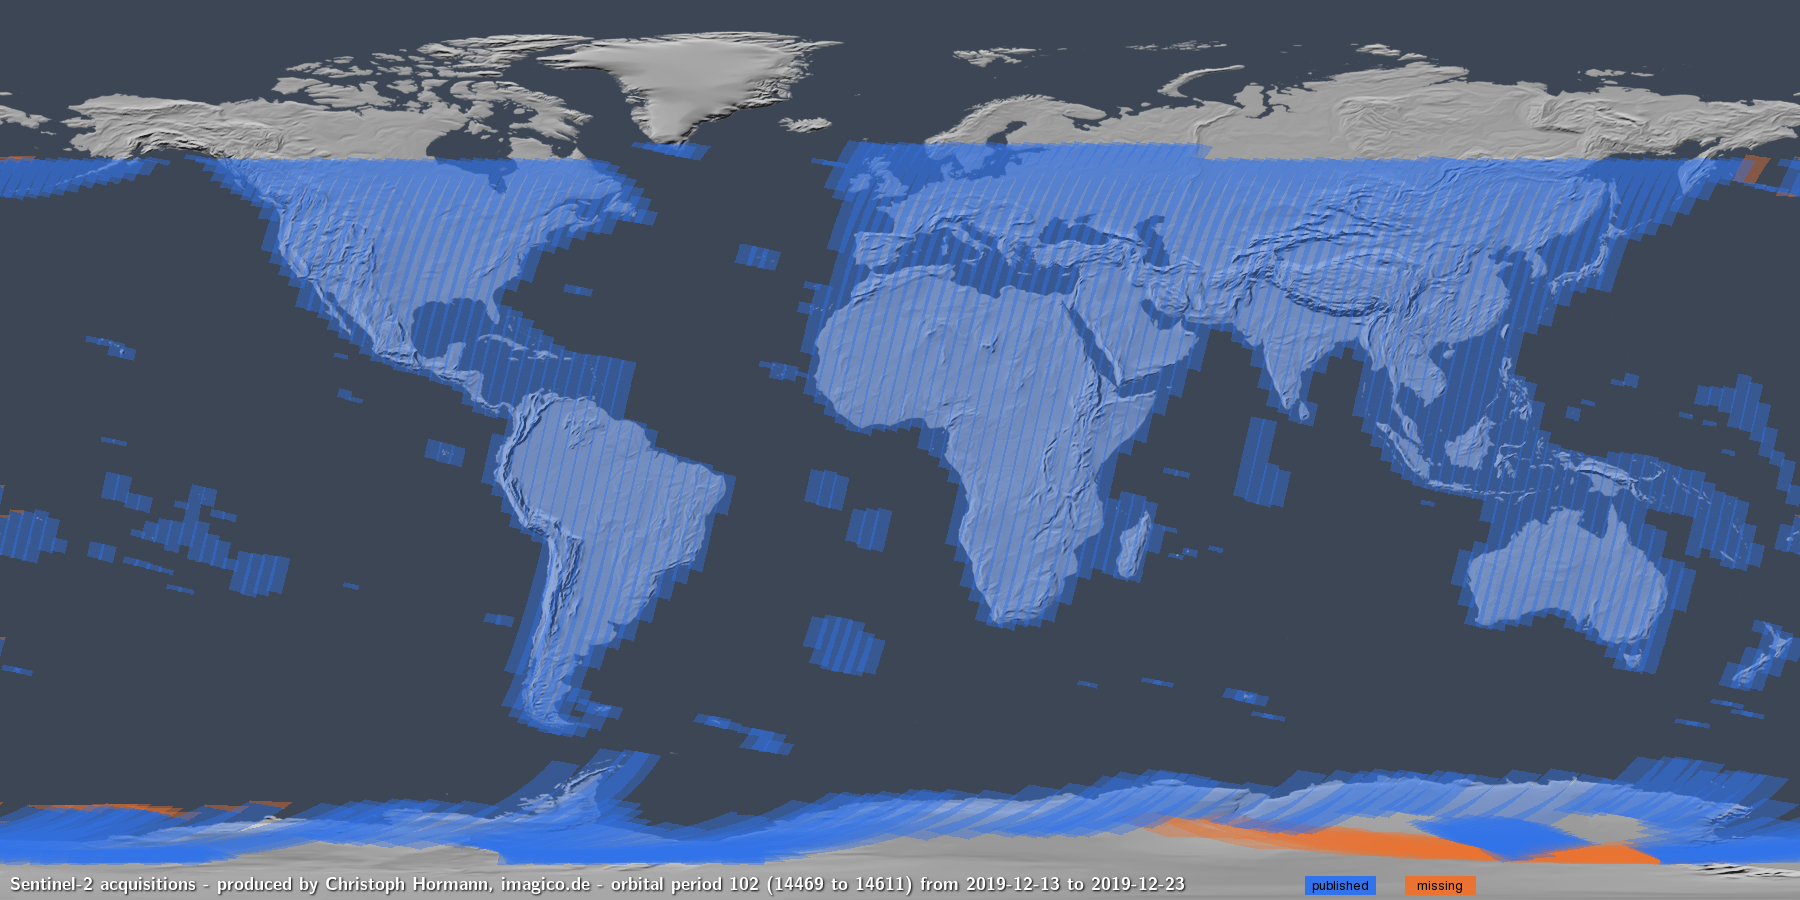
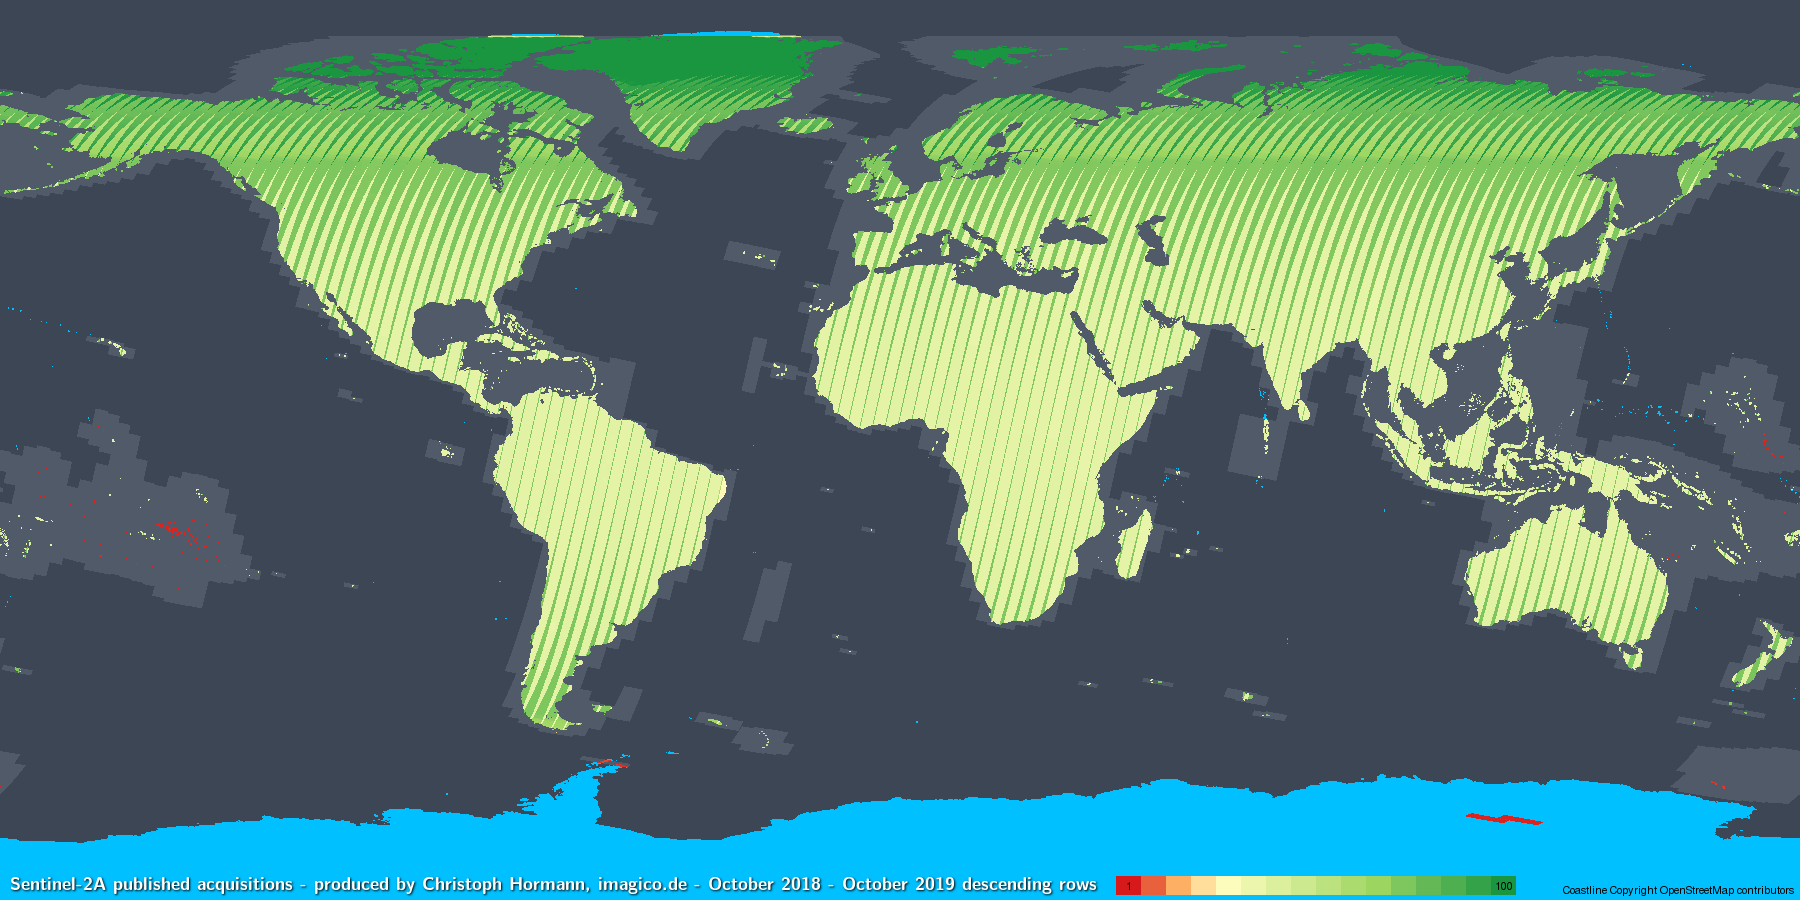
ESA for Sentinel-2 did mostly stick to the same procedure as last year – except for the smaller changes mentioned already. Which means continuing to operate Sentinel-2A and Sentinel-2B in a distinctly different way and catering to special interests in an ostentatious fashion. There were some non-regular recordings for several small island and reef areas in the Pacific (Kiribati, French Polynesia) by Sentinel-2A this year for the first time though. And what has significantly been reduced is the number of planned recordings missing from the image collection.
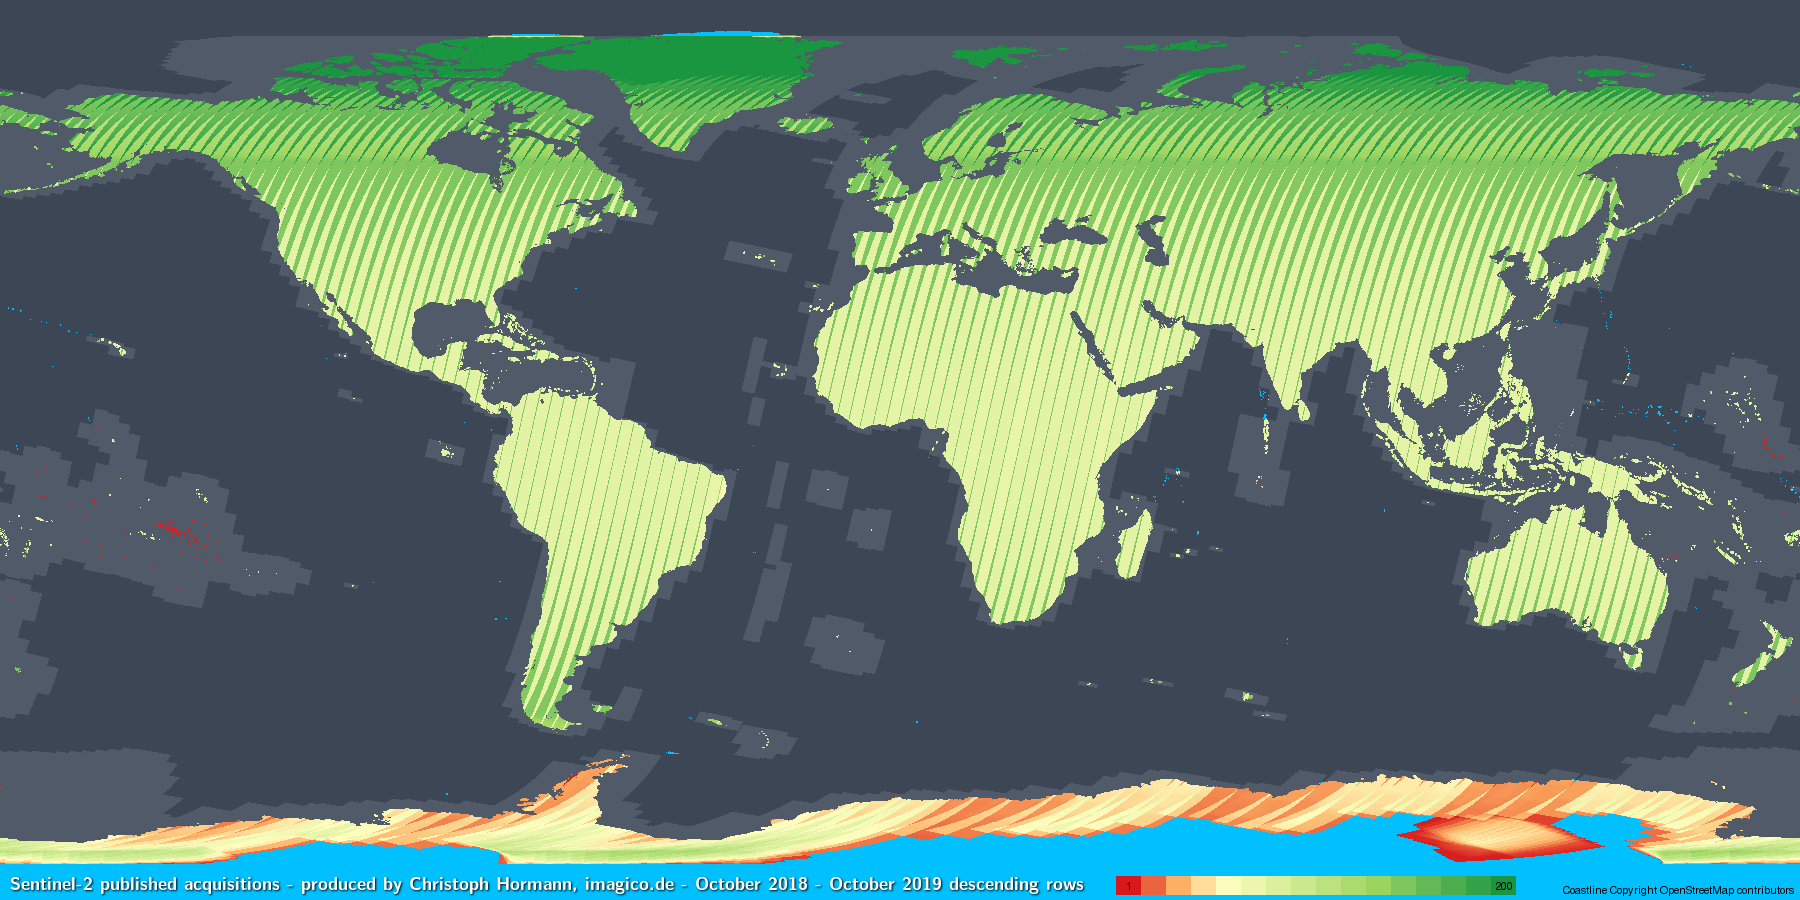
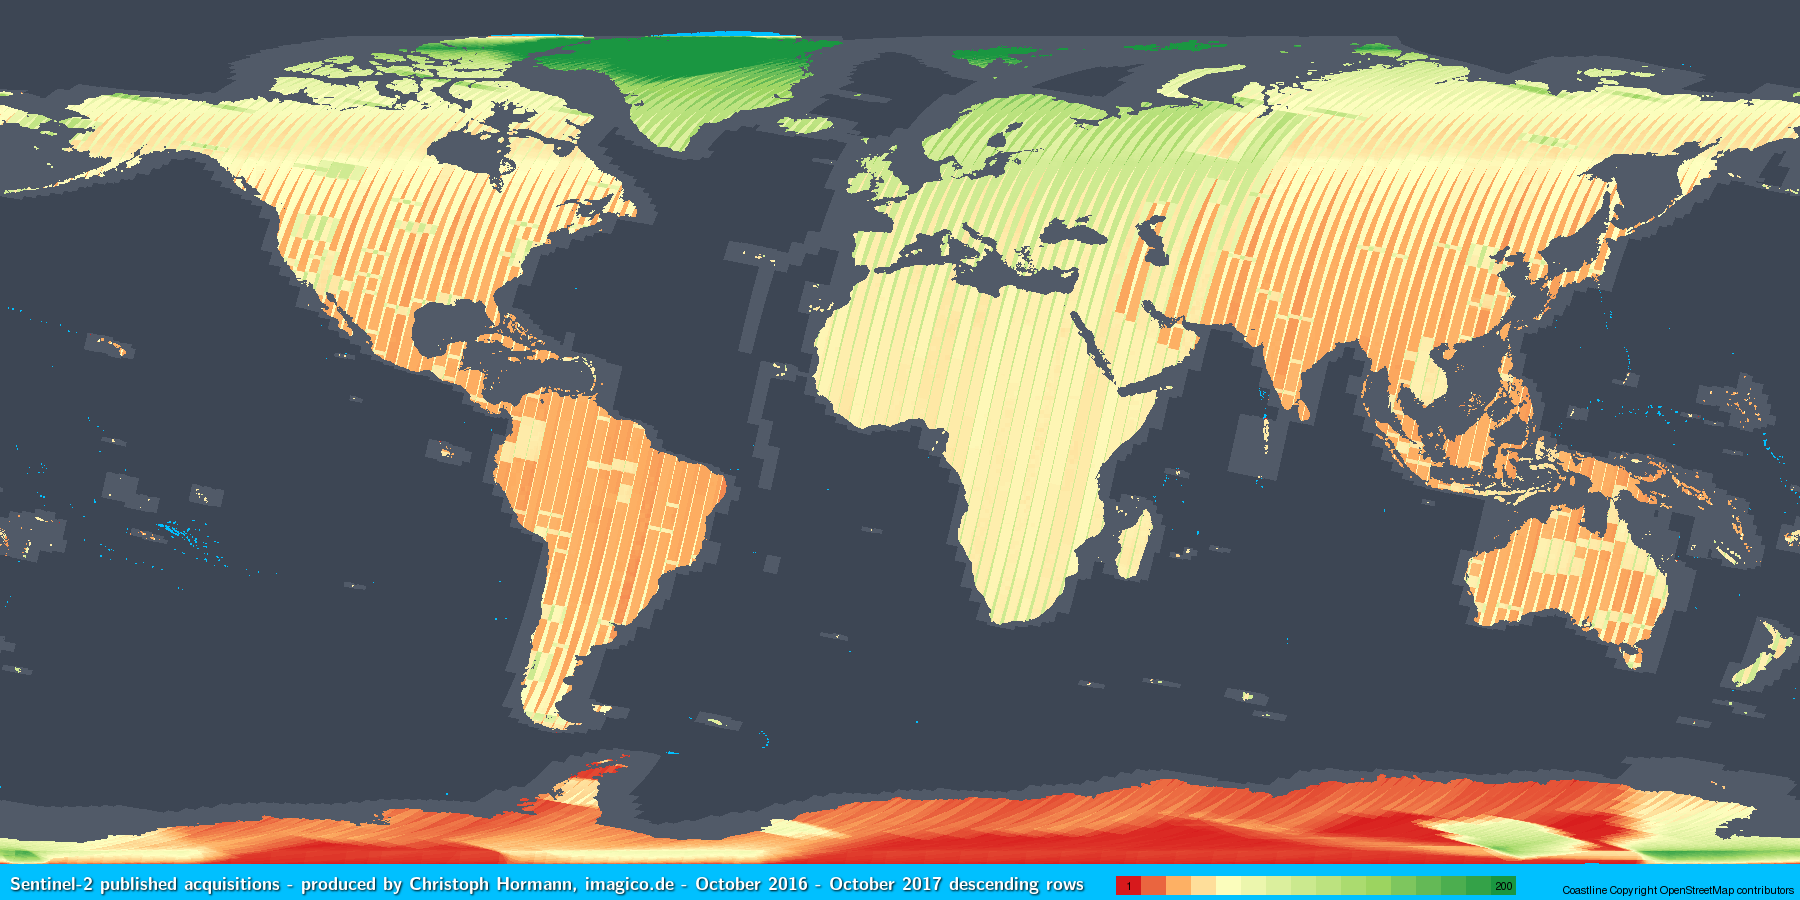
Sentinel-2 2019
Overall my recommendation to both USGS and ESA:
- make use of the capacity you have in the northern hemisphere winter to collect more than just sporadic data of the Antarctic.
For the USGS in addition:
- finally get rid of the last gap in your land area coverage (Iony Island).
- record off-nadir images of northern Greenland and the central Antarctic on a regular basis (and preferably make use of the flexibility you have here with the chosen path for cloud cover minimization).
And for ESA:
- stop the non-professional and short sighted catering of special interests and record images based on clear, uniform and transparent criteria.
- connected to that: rethink your strategy of recording extensive ocean areas around some islands while not recording other larger islands (South Orkney Islands) at all.
- record with Sentinel-2A and Sentinel-2B the same way or explain clearly why you don’t.
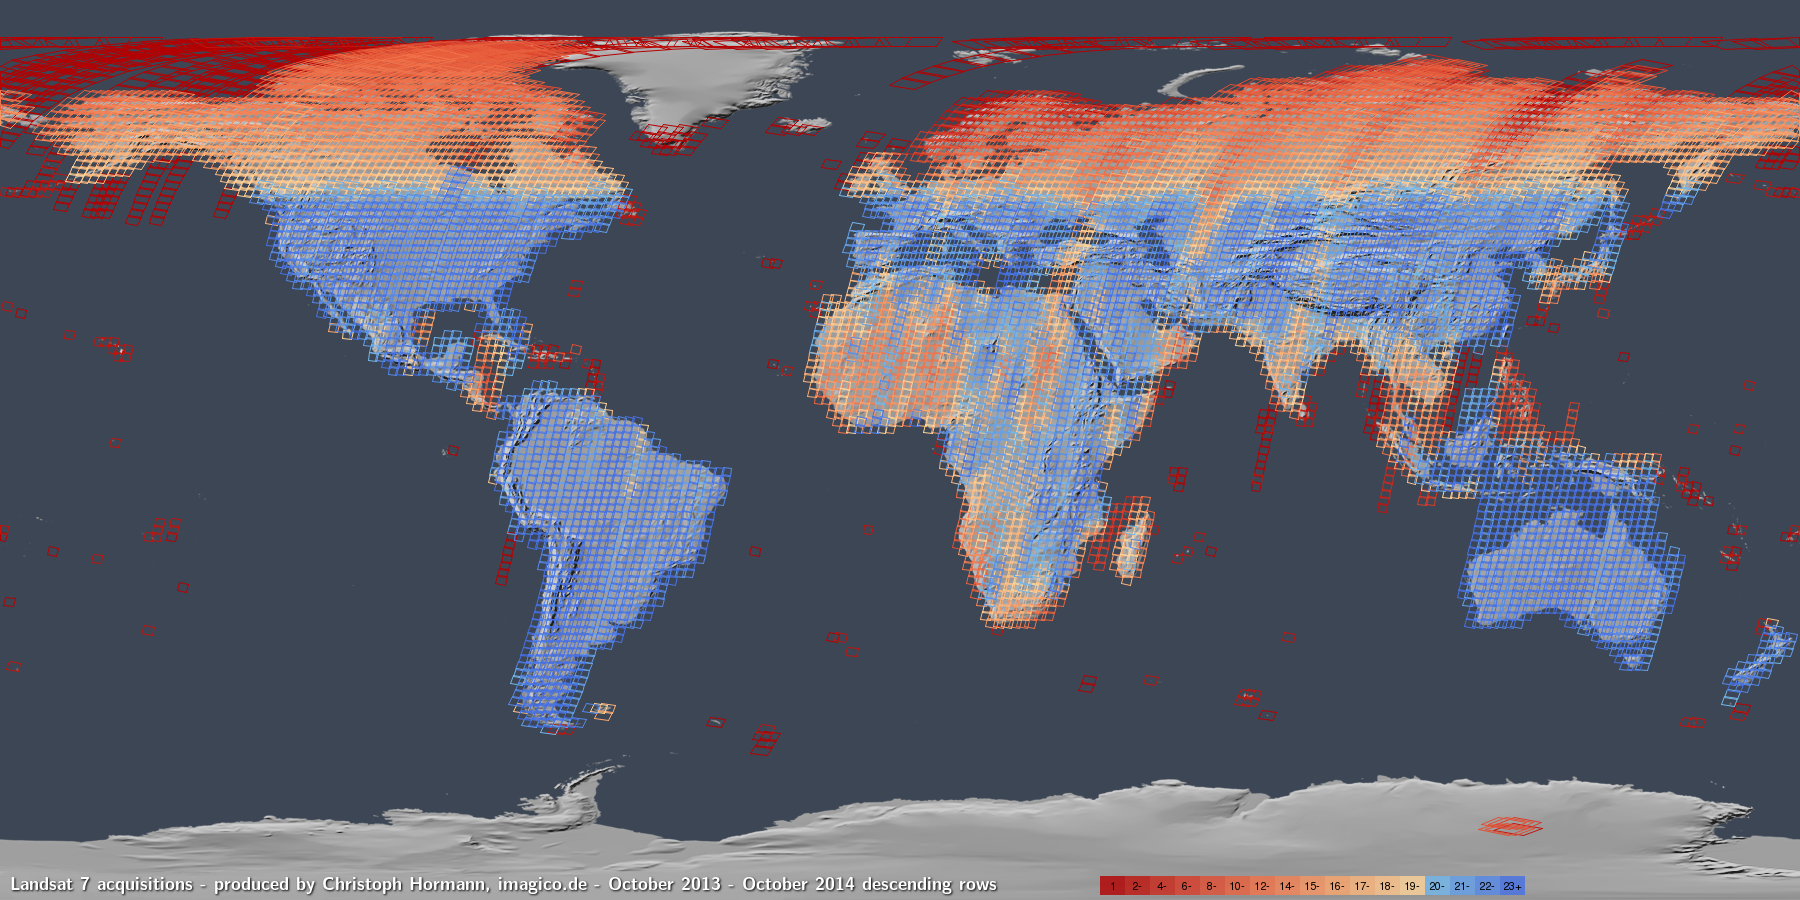
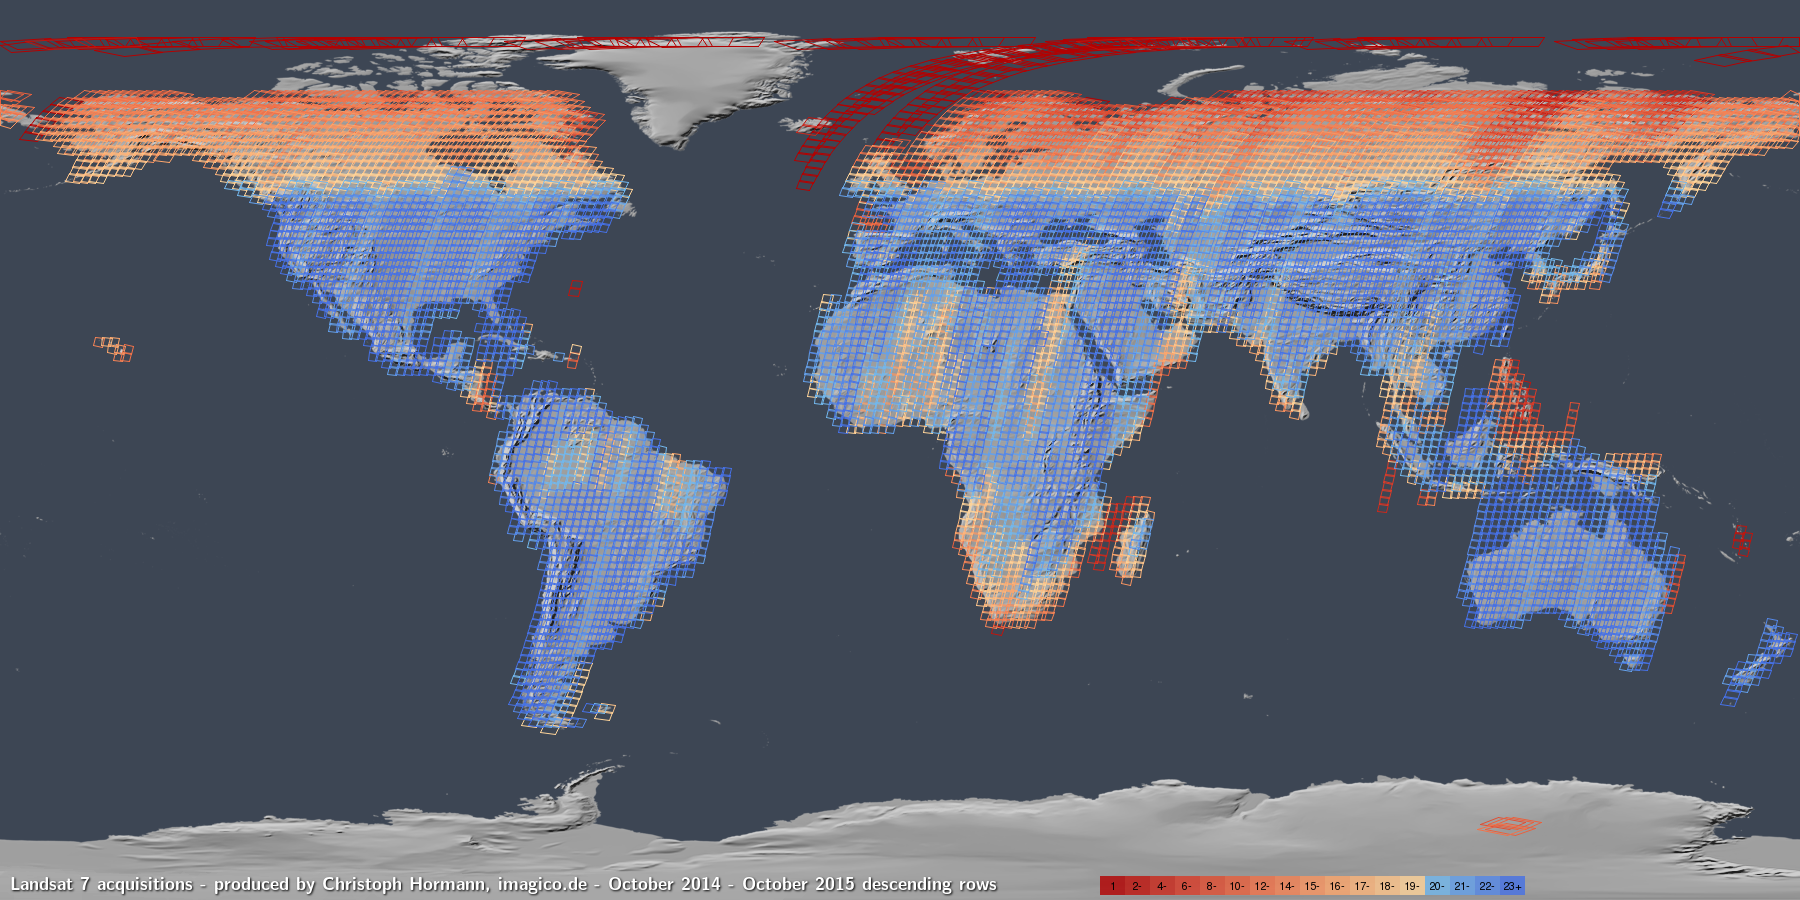
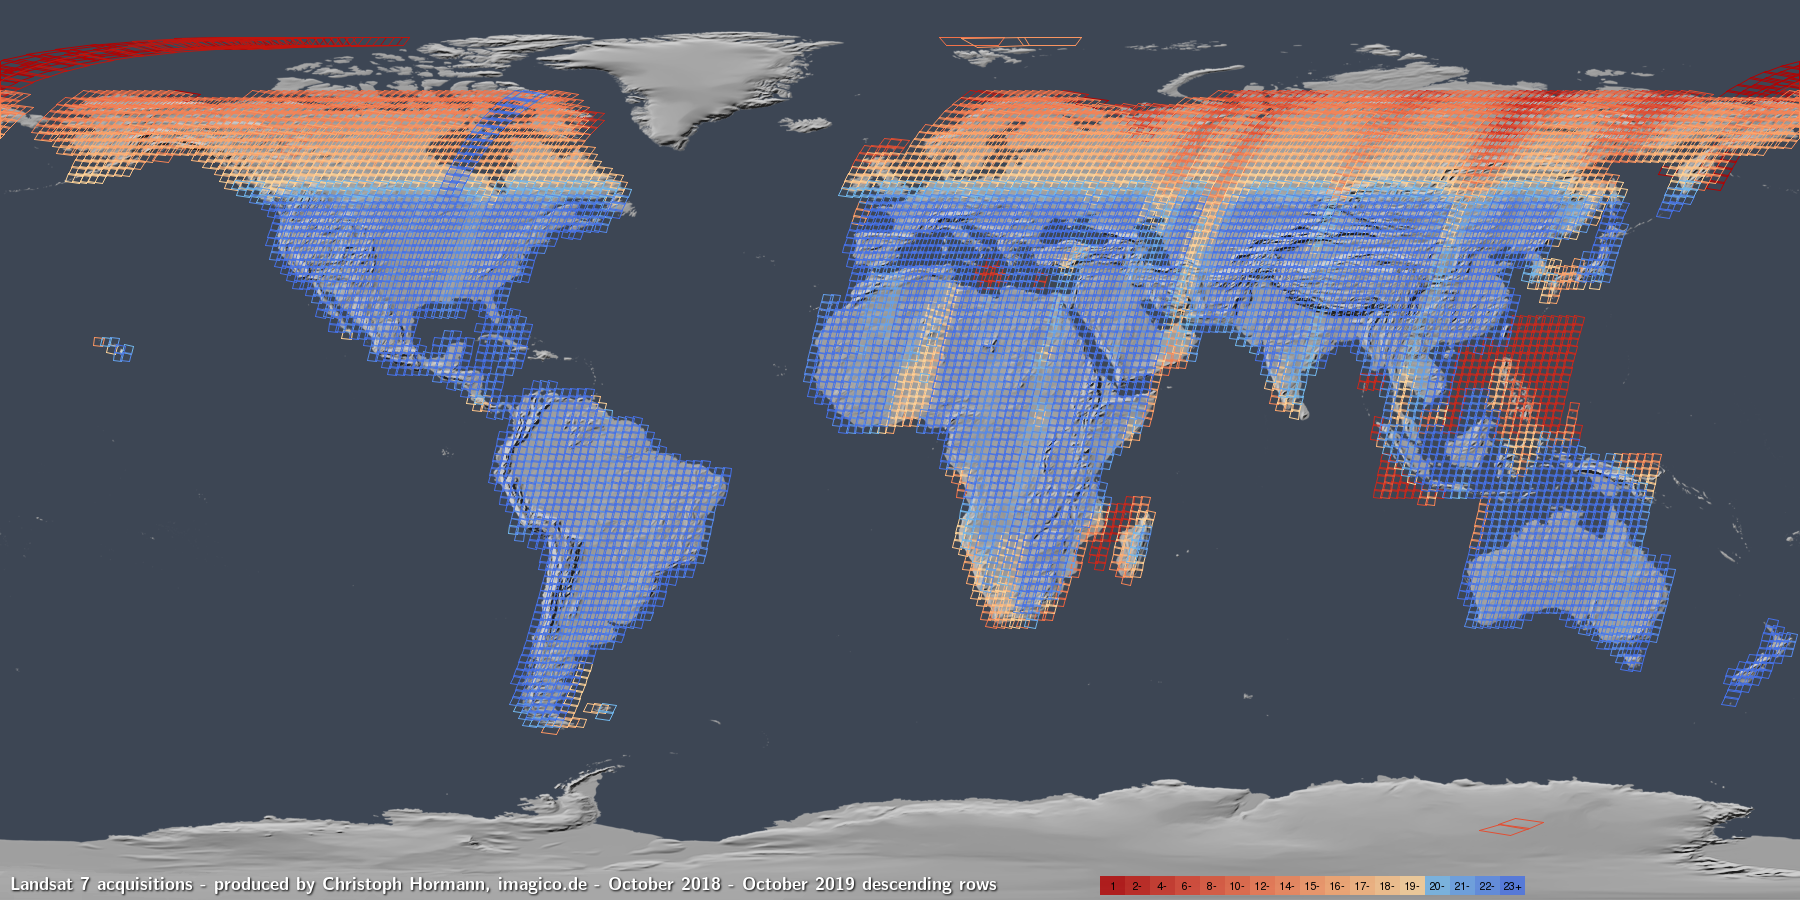
And here all of the maps showing image coverage together:
| year | day | night | day pixel coverage |
|---|---|---|---|
| 2014 | LS8, LS7 | LS8 | LS8 |
| 2015 | LS8, LS7 | LS8 | LS8 |
| 2016 | LS8, LS7 | LS8 | LS8, S2A |
| 2017 | LS8, LS7 | LS8 | LS8, S2A, S2B, S2 (both) |
| 2018 | LS8, LS7 | LS8 | LS8, S2A, S2B, S2 (both) |
| 2019 | LS8, LS7 | LS8 | LS8, S2A, S2B, S2 (both) |