As regular readers of this blog know i have produced quite a few satellite image mosaic products over the past years and reviewed the work of others in that field as well. New products of this type have been introduced quite frequently by various companies over the past 2-3 years but amazingly it seems quality of those has largely plateaued – most of the stuff being produced these days i don’t really find innovative enough to warrant a closer look.
And this is despite the fact that we have a lot of factors that could be considered to provide good conditions for quality improvements:
- newer satellites are producing higher quality data.
- we have a quickly growing body of image data that can be used as data source for image mosaic production.
- computers to process the data are getting more powerful and cheaper.
The question i want to shed some light on is why despite these promising circumstances we don’t see a widespread improvement in quality of end use satellite image mosaic products being available in services.
There are economic factors involved here of course but one of the most important reasons is technological. Focus in satellite image mosaic production over the past 5-10 years has almost exclusively been on what i call pixel statistics techniques. The Mapbox cloudless atlas has been the iconic example for this. It was not the first – the Blue Marble Next Generation from 2005 was technically also based on pixel statistics and techniques like this date back at least to early AVHRR data products in the 1980s. But the Mapbox mosaic was the first such product commercially produced on a global level for direct visual application.
Pixel statistics techniques means that for every pixel in your processing grid you take all the source image data you have from different images taken at different times and you run some statistics over it to estimate an ideal, representative pixel value to be used in the image mosaic to be created.
The statistics used can be very simple – which can under the right circumstances still lead to pretty good results, this is what the Mapbox mosaic nicely demonstrated. But they can also be more complex and even take into account other secondary data sources not derived from the image data. My Green Marble mosaic demonstrates this quite well. The main point all these techniques have in common is that every pixel is treated independently. This makes it a very attractive approach because it is (a) relatively simple to formulate an algorithm for this and (b) it is very efficient to run on a large scale. These advantages have led to almost everyone who wanted to do something in the field of satellite image mosaic production in recent years to choose a pixel statistics based approach.
What people apparently often have not realized when making this decision is that this strategy does not work equally well at different spatial resolutions. Satellite image mosaicing is not a scale independent problem. I hinted this already back when reviewing the Google Landsat mosaic.

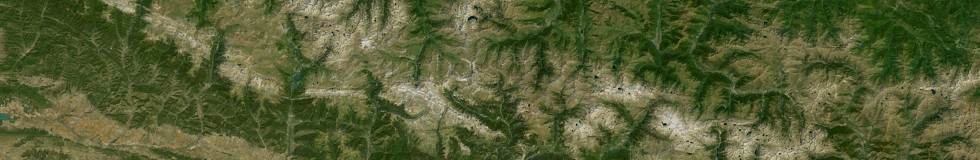
pixel statistics at 250m resolution – the Green Marble
The thing is at a pixel size of 250m or more you can reasonably treat every pixel of the image independently. As long as you have a sufficiently broad data basis for your statistics to converge leading to low uncorrelated noise levels and no significant banding artefacts and your statistical method is well chosen you can achieve well readable results. But if you move to significantly higher resolutions this does not work any more because our ability to read and understand a higher resolution image of the earth surface depends increasingly on fairly delicate spatial relationships within the image. And this is frequently lost if you treat every pixel independently.

 15m resolution Landsat images
Many pixel statistics based mosaics you can find made from Landsat or Sentinel-2 data do not actually get to the point where you can see that because the mentioned requirements are not met (broad enough data basis and suitable statistical approach) but when they do the results usually still appear confusing and are way behind an individual high quality image in terms of acuity and readability.
In short: Pixel statistics are a highly attractive method for image mosaic production that can work very nicely and efficiently at coarse resolutions. But they are practically unsuitable for much higher resolutions. I have never seen anyone attempting to apply pixel statistics methods to very high resolution images with pixel sizes in the sub meter range and it would probably look pretty horrible (though it might nicely demonstrate the point i am trying to make here). In the intermediate resolution range you see an effect of diminishing returns, i.e. when all other things are equal you would see that increasing source image and processing grid resolution would at some point not significantly improve the quality of the resulting image any more.
")
") Sub-meter resolution images (from IGN Spain)
Sub-meter resolution images (from IGN Spain)
Practically this effect overlaps with other influences like the limitations in positional accuracy of the source images and the typically lower number of images available at higher resolutions so it can be practically difficult to separate different effects. But while the latter problems can be overcome with technological improvements the main problem is a principal one that will always pose a hard limit to methods based on pixel statistics.
And ultimately this is why quality of satellite image mosaic products has not much improved in the last years.
Because of these limitations i have – for higher resolution mosaics in the Landsat/Sentinel-2 resolution range (10-15m) – always concentrated on methods not based on pixel statistics. But pixel statistics have their charm – economically but also because you can produce very accurate colors. Colors in an individual satellite image are always subject to the specific conditions under which the image was taken. You can put a lot of effort into counteracting that with atmosphere and BRDF compensation but such methods also inevitably introduce variance due to inaccurate simplifying assumptions being made. With a sufficiently broad data basis pixel statistics can help reducing this variance and give you more precise colors.

pixel statistics based on Landsat images
This is why i looked into pixel statistics based methods for Landsat and Sentinel-2 images recently. Not so much because of the higher resolution (which is nice to have but as explained comes with diminishing returns). More because what you can achieve in terms of colors.
More on that in the next post. Until then here a quick teaser:
