
In June ESA launched their Sentinel-2A earth observation satellite and i criticized the hyperbole in their announcement – claiming it to be revolutionary before it even returned a single byte of observation data. It seems they took this criticism to heart since half a year later in December they quietly started publicly distributing data – still indicated as preliminary but half a year after start should have given them enough time to solve the basic issues.
I am going to report about my initial impression here in form of two four blog posts. This first one is not going to be about the data yet, it is only about the process of accessing it (i.e. what you need to do before you can even start to look at the data itself). The second part (with amendment) is going to be about the data itself and finally there is an overall comparison with Landsat.
getting the data
To access Sentinel-2 data from ESA you have to go to the Scientific Data Hub i think. I write i think since as usual with ESA things are not really clear. There seem to be other mechanisms to access data but it seems this is only for members of partner organizations and not for normal mortals.
Before Sentinel-2 with only Sentinel-1 data they had an API (which i shortly discussed in the previous Sentinel post) and a rudimentary user interface for it. This still exists but they now also have a new interface with a more modern look and somewhat improved ease of use.
You can access the Sentinel-2 data with all these methods – the Sentinel-2 Pre-Operations Hub allows to do this without registration using a guest account (which is nice since it significantly lowers the threshold to access the data – although normal registration is automatic and fairly easy as well). It seems this guest account also works on the standard Scientific Hub and you can also access Sentinel-1 data with it. I have however received error messages indicating the guest account is limited to two parallel downloads which – as you probably can imagine – does not make that much sense. So it is likely intended to have a quick look and not to actually download data.
Overall the whole data access system does not seem to be very stable. Getting a will be back online shortly message is normal and it seems when downloading files interruptions are also quite frequent so make sure you use a download manager that can resume interrupted downloads (and download speed is – well – varying…). If i consider the fact that full scale data acquisition with two satellites has not started yet and use of the platform is probably still fairly low volume at the moment i am worried – this all does not really looks like it is designed to scale.
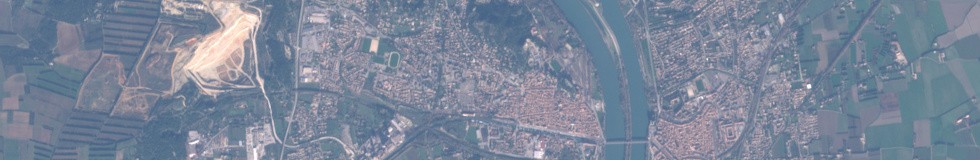
An interesting general observation – i already mentioned in my previous text on Sentinel that ESA is quite squeamish about getting credits for anything they produce but is not very generous in crediting others. The tiny hardly readable font size in the credits for their background map is a great example for this – i am pretty sure this is not what the ODbL has in mind when it says reasonably calculated to make any Person … aware…
![]()
And since they use tiles from openstreetmap.org they quite definitely violate the tile usage policy.
Getting back on topic: When i wrote about the Sentinel-2 launch i mentioned the somewhat unusual planned form of data distribution and i was not sure how they were going to practically manage that. It seems on the outside their data packaging is in principle fairly similar to that of Landsat after all. They also have scenes which represent cuts along the satellite path. In contrast to Landsat where scenes also represent the basic units of acquisition Sentinel-2 acquisitions (called data strips by ESA) routinely start or end mid-scene. Since Sentinel-2 covers a wider area and has a higher resolution the scenes are much larger, file sizes for download are around 6GB. Only Level 1C data is distributed apparently (that is geometrically corrected top-of-atmosphere reflectance – pretty much the same as Landsat Level 1 data)
One significant problem is however that the query interface does not show accurate scene footprints for Sentinel-2 scenes, it only shows which of the 100×100 km tiles of their splitting system (i will get to that later) are included. This looks like the following.

The green areas are Sentinel-2 footprints while the red ones are the much more accurate and useful Sentinel-1 footprints. You also can’t get a scene preview into the map so it is difficult to determine if a certain scene exactly covers your area of interest or not.
Downloading a scene once you found it is straight away – you also get a permalink to directly access the download package (that you can add to a list for automated download later for example). This is something that works much better than with Landsat and the USGS where bulk download is much less easy and flexible. But the good news mostly ends here.
accessing the data
Now you have downloaded your ~6GB file – how can you use it? For reference i will first show you how this looks like with Landsat-8. This might seem unfair since Sentinel-2 has a larger data volume and more bands but it is none the less a fair comparison i think.
After you have downloaded a Landsat-8 scene (which might indeed be somewhat more difficult for a first time user than with Sentinel-2) you have a gzipped tar archive containing:
> tar tf LC82330182014233LGN00.tar.gz

LC82330182014233LGN00_B2.TIF

LC82330182014233LGN00_B3.TIF

LC82330182014233LGN00_B4.TIF

LC82330182014233LGN00_B5.TIF

LC82330182014233LGN00_B6.TIF

LC82330182014233LGN00_B7.TIF

LC82330182014233LGN00_B8.TIF

LC82330182014233LGN00_B9.TIF

LC82330182014233LGN00_B10.TIF

LC82330182014233LGN00_B11.TIF

LC82330182014233LGN00_BQA.TIF

LC82330182014233LGN00_MTL.txt
12 GeoTIFF files (uncompressed), one for each band and a QA image plus a metadata text file. This is about as spartan as it gets. Also note the archive file name and the prefix of the individual file names is all the same – a standardized scene ID containing mainly the scene location (path and row in the WRS2 system) and the acquisition date (year + day number).
For Sentinel-2 you get a zip file which contains – i will spare you the full list – 1138 files.
The file name for the zip package looks like this:
S2A_OPER_PRD_MSIL1C_PDMC_20151230T202002_R008_V20151230T105153_20151230T105153.zip
As you can see it contains three timestamps – two of which are identical – and no information on the location. This means if you have a number of Sentinel-2 data packages you have no way to determine where these are located without looking into them or using the ESA API (assuming one of the timestamps is the acquisition date and you can look up a scene through that).
The package content structure seems to be a clear case of design by committee. They even have a HTML directory in there with a HTML file with some basic scene information (including a cloud cover estimate with 15 digits…) and 140 kB of logos in PNG format they distribute with every scene. No need to mention that the directory and file names within the package contain – you probably already guessed it – at least four other different timestamps. This might be elegant if you want to unpack a number of different versions and processings of the same scene into the same directory structure but for practical use of the data this is just a nightmare (sometimes you really wish back the old DOS days with 8+3 file names…)
But enough of that – after all we are interested in the data and there is indeed some useful data hidden deep in these files. For example in
S2A_OPER_PRD_MSIL1C_PDMC_20151230T202002_R008_V20151230T105153_20151230T105153.SAFE/GRANULE/S2A_OPER_MSI_L1C_TL_SGS__20151230T162342_A002722_T31TFJ_N02.01/IMG_DATA
you find:
S2A_OPER_MSI_L1C_TL_SGS__20151230T162342_A002722_T31TFJ_B01.jp2

S2A_OPER_MSI_L1C_TL_SGS__20151230T162342_A002722_T31TFJ_B02.jp2

S2A_OPER_MSI_L1C_TL_SGS__20151230T162342_A002722_T31TFJ_B03.jp2

S2A_OPER_MSI_L1C_TL_SGS__20151230T162342_A002722_T31TFJ_B04.jp2

S2A_OPER_MSI_L1C_TL_SGS__20151230T162342_A002722_T31TFJ_B05.jp2

S2A_OPER_MSI_L1C_TL_SGS__20151230T162342_A002722_T31TFJ_B06.jp2

S2A_OPER_MSI_L1C_TL_SGS__20151230T162342_A002722_T31TFJ_B07.jp2

S2A_OPER_MSI_L1C_TL_SGS__20151230T162342_A002722_T31TFJ_B08.jp2

S2A_OPER_MSI_L1C_TL_SGS__20151230T162342_A002722_T31TFJ_B09.jp2

S2A_OPER_MSI_L1C_TL_SGS__20151230T162342_A002722_T31TFJ_B10.jp2

S2A_OPER_MSI_L1C_TL_SGS__20151230T162342_A002722_T31TFJ_B11.jp2

S2A_OPER_MSI_L1C_TL_SGS__20151230T162342_A002722_T31TFJ_B12.jp2

S2A_OPER_MSI_L1C_TL_SGS__20151230T162342_A002722_T31TFJ_B8A.jp2
which does not look so much unlike the content of the Landsat package. The image files – one for every band like with Landsat – are in JPEG2000 format. The choice of file format can be argued about i suppose – for size efficiency it might be considered to make sense but for performance this is not a good idea. Likely the first thing you will want to do is convert this into a flat uncompressed tiff. Regarding performance also remember the data came in a zip package and there is not really a point in zipping and unzipping data that is already in strongly compressed form. The USGS took the right approach in using an uncompressed format and compressing the whole package for data transfer. A data user who wants the image files compressed should choose the format according to the individual requirements – the data provider trying to make this choice for all data users together in a one-size-fits-all manner is a waste of resources. But in the design phase someone probably had space efficient image file format on the checklist…
The above is not the data for the whole scene though, there are 12 more directories with a similar set of files in the package (the exact number varies from scene to scene). Here the special structure of the Sentinel-2 data comes in. The scenes are cut into a globally fixed tiling system, the MGRS. This seems fairly simple at first but the MGRS tiles of a scene are not always in the same projection and at the edges of the UTM zones the projections of the individual tiles differ. This is not a big deal and the individual tiles have some overlap in general which makes the scene previews which are just assembled from the individual tiles look somewhat irritating.

You might ask why the ESA is doing this – the answer is probably again the larger scene size of the Sentinel-2 data. In case of Landsat the individual scenes are always in a single UTM projection assigned to the WRS2 tile according to its center. This means parts of the scene can extend outside the UTM zone but not too much since the scene is quite small. With the larger Sentinel-2 scenes this would be different. Concerns regarding projection math accuracy, distortion and scale variation have probably lead to the decision to not always use the same projection for the whole scene.
For practical use you will probably want to reproject all tiles of a scene (or at least all tiles within your area of interest) into a single projection and merge them into a single file unless you only need one or two of the tiles. Having a set of GDAL VRT files already included to transparently accomplish that is probably too much to ask – and it would likely be very inefficient with the JPEG2000 files.
metadata worries
The situation with metadata is about the same as for the package structure in general. We remember: with Landsat we have a single text file with metadata which at least from my perspective contains everything you need to know for the individual scene that cannot be determined from the image data itself. In case of Sentinel-2 there are several files which contain metadata, most notably a more than 13MB XML file containing tons of information for the data strip (the sequence of acquisition extending across multiple scenes), especially on satellite status and telemetry – all kind of voltages, temperatures and other stuff measured when the image was taken. The scene specific metadata is provided on a per tile basis in an ~1MB XML file for every tile. You for example find there the sun direction in a 5000m grid encoded in XML in a very peculiar way although it is not clear how this is aligned to the tile. There probably is some specification available somewhere for this. It is quite obvious that someone at ESA really likes XML.
Overall the metadata provided probably contains everything you need – and a lot of things you probably will never need which makes the useful stuff difficult to find and extract.
So much for the basics of accessing Sentinel-2 data – in the second part i will look into practical aspects of concrete data use.
.
January 12, 2016 at 18:04
Thank you for this blog, it has been very useful in understanding the delivery structure of the data which as you point out is a bit of a minefield! I had downloaded a sample area and was surprised by the size of the download (6GB). Not being familiar with the MGRS meant I was unable to locate the city I live in (Southampton, UK) in the data I had downloaded! Turns out Southampton is in T30UXB… Anyway anyone reading this blog and thinking of having a play with Sentinel 2 data I would recommend going to this web page and downloading the World wide 100k layer: http://earth-info.nga.mil/GandG/coordsys/gislayers/gislayers.html
July 12, 2016 at 17:27
I really enjoyed your posts, I just starting using Landsat 8 and Sentinel 2 images and I found this interesting blog. I have seen in other sites images processed with the split window algorithm to get Bottom Of Atmosphere clearer images. Do you use this algorithm, or do you know a simple way to obtain BOA images?
Thank you
July 14, 2016 at 14:05
There are a large number of algorithms to estimate surface reflectance information from raw satellite image data. They all have their advantages and disadvantages and there is no one good solution for this problem – what the best method is depends on the individual use case.